Soybeans Elliott Wave technical analysis [Video]
![Soybeans Elliott Wave technical analysis [Video]](https://editorial.fxstreet.com/images/Markets/Commodities/Agriculture/soybean3-637443204454550091_XtraLarge.jpg)
Soybeans Elliott Wave analysis
Function - Trend.
Mode - Impulse.
Structure - Double Zigzag for (2).
Position - Wave 2 of (5).
Direction - Wave 3 of (5).
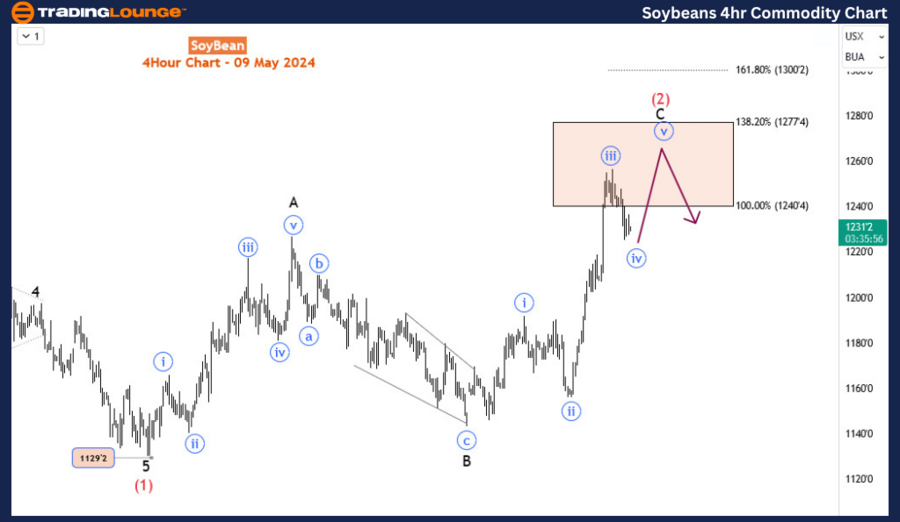
Details - More leg higher in the zone is expected to complete wave C of (2). Wave (3) could start from there downwards. However, invalidation for wave (2) remains at 1327’4.
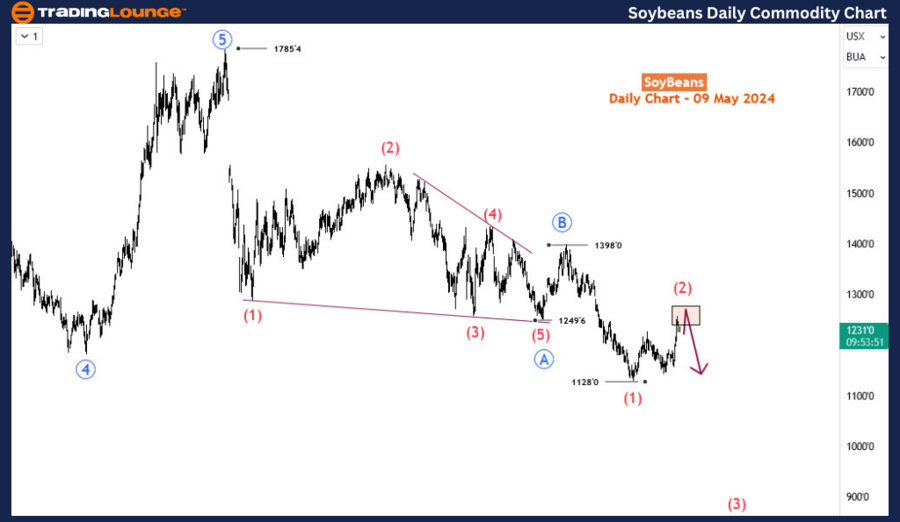
Soybean has staged an impressive rebound, surging by over 9% since hitting its low in March 2024. However, this upswing is likely corrective, indicating that the bearish corrective phase stemming from the high in June 2022 is poised to persist, pressuring prices downward in the weeks ahead. The pivotal point to watch is whether it remains below the November 2023 high of 1398; breaching this level could signal an end to the bearish corrective cycle. Long-term buyers may need to exercise patience as the ultimate low has yet to be attained. This analysis delves into potential opportunities for selling the commodity.
Examining the daily chart, it's evident that a prolonged bearish correction commenced in June 2022. Before this, Soybean prices experienced a notable uptrend, rallying by 126% between May 2019 and June 2022, completing a bullish impulse wave. Consequently, the downturn from June 2022 serves as a correction to this preceding bullish phase. Upon completion of the bearish correction, the overarching bullish trend is anticipated to resume. However, the chart pattern since June 2022 appears to be shaping into a zigzag formation, identified as primary degree A-B-C marked in blue.
The initial blue wave A concluded at 1249 in October 2023, characterized by a diagonal structure. This was followed by a modest rebound for the corresponding blue wave B, reaching 1398 before prices resumed their descent in the third leg - blue wave C. The latter completed an impulse move from 1398, bottoming out at the low of 1129 in March 2024 before the current recovery. However, probably, this impulse wave has only completed the intermediate sub-wave (1) of blue wave 5. A confirmation of the conclusion of the corrective cycle from June 2022 would necessitate the current recovery from the March 2024 low of 1128 evolving into an impulse wave towards the November 2023 peak of 1398. It's plausible to view the ongoing recovery as wave (2) of blue wave C.
The H4 chart illustrates wave (2) unfolding in a zigzag pattern, with wave C of (2) nearing completion as it forms an impulse within a reversal zone spanning 1240-1277. Anticipated is one final push higher within this zone, followed by a potential bearish response that could pave the way for a subsequent sell-off in wave (3). However, should the current recovery breach the 1300 mark (161.8% Fib extension level), there's a substantial likelihood of an impulse recovery from the March 2024 low of 1129, potentially invalidating this outlook and suggesting further upward movement for wave (2) or even signaling the conclusion of the long-term bearish correction initiated in June 2022.
Soybeans Elliott Wave technical analysis [Video]
Author

Peter Mathers
TradingLounge
Peter Mathers started actively trading in 1982. He began his career at Hoei and Shoin, a Japanese futures trading company.


