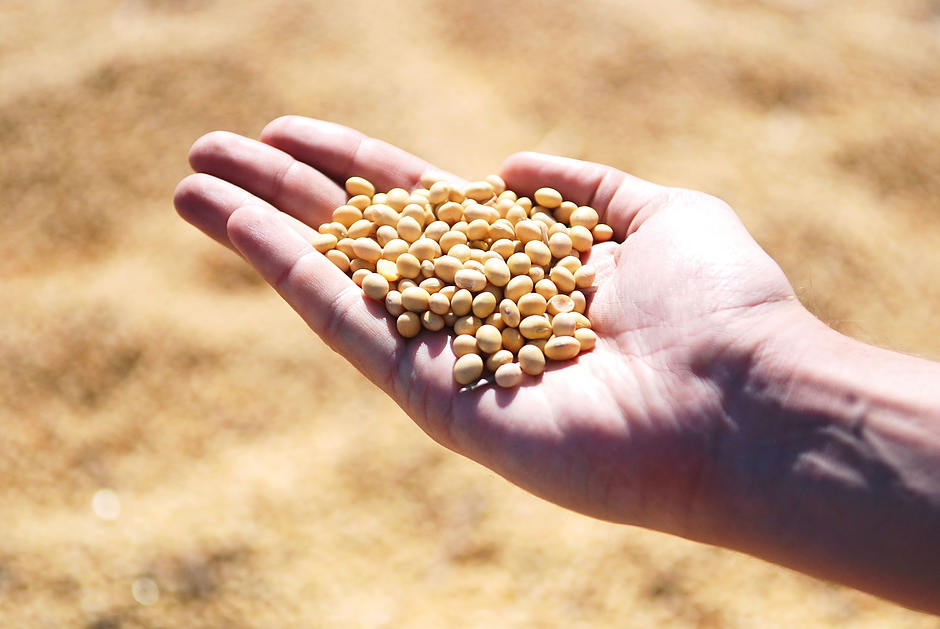
Soybean meal technical analysis: Will the SOYBM quotes continue to rise?
Soybean meal technical analysis summary
Buy Stop: Above 335
Stop Loss: Below 310
| Indicator | Signal |
| RSI | Neutral |
| MACD | Buy |
| MA(200) | Neutral |
| Fractals | Buy |
| Parabolic SAR | Buy |
| Bollinger Bands | Neutral |
Soybean meal chart analysis
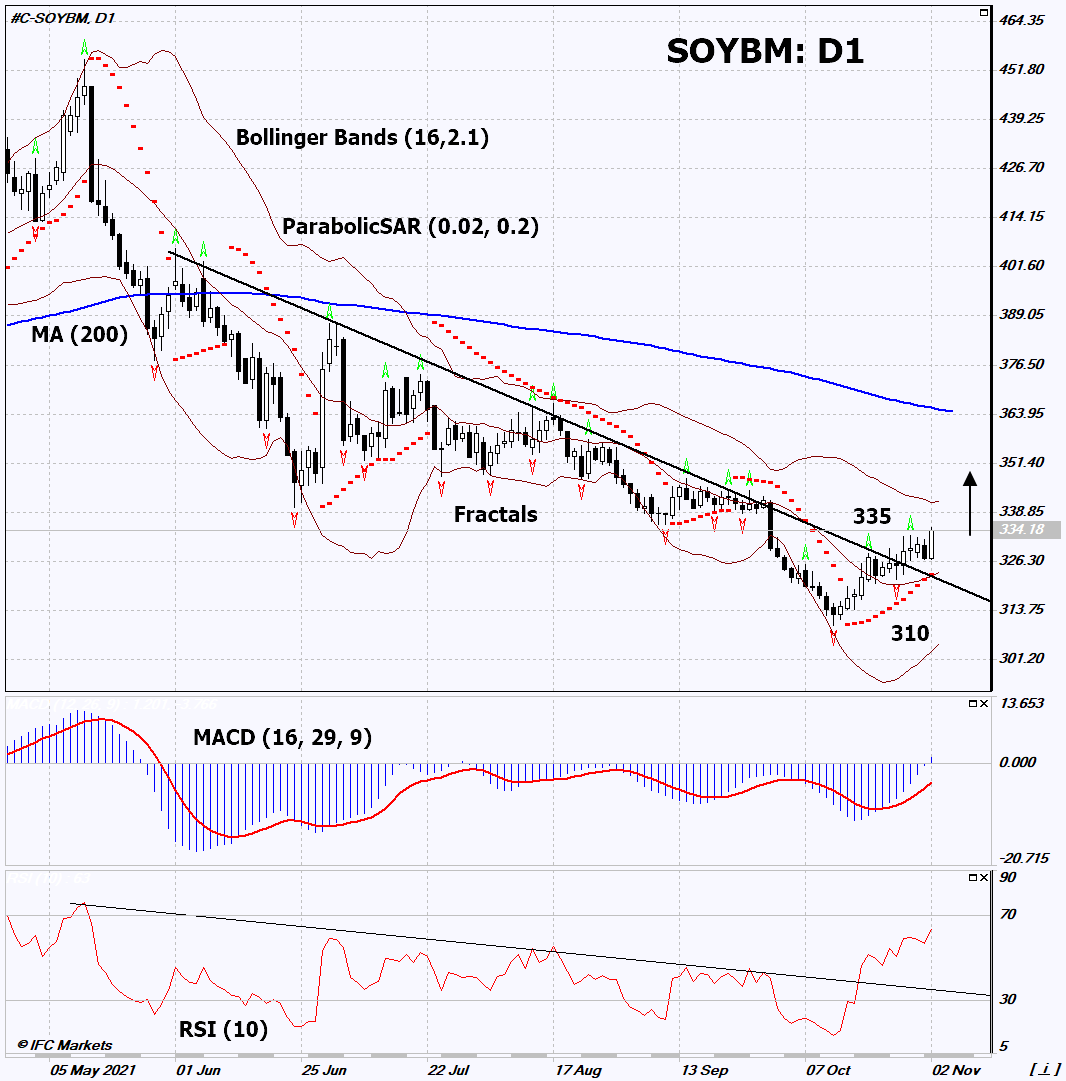
On the daily timeframe, SOYBM: D1 broke up the downtrend resistance line. A number of technical analysis indicators formed signals for further growth. We do not rule out a bullish movement if SOYBM rises above the last high: 335. This level can be used as an entry point. The initial risk limitation is possible below the minimum since September 2020, the last two lower fractals and the Parabolic signal: 310. After opening a pending order, move the stop following the Bollinger and Parabolic signals to the next fractal minimum. Thus, we change the potential profit/loss ratio in our favor. The most cautious traders, after making a deal, can go to the four-hour chart and set a stop-loss, moving it in the direction of movement. If the price overcomes the stop level (310) without activating the order (335), it is recommended to delete the order: there are internal changes in the market that were not taken into account.
Fundamental analysis of commodities – Soybean meal
According to the United States Department of Agriculture (USDA), processing of US soybeans declined in September. Will the SOYBM quotes continue to rise?
An increase in demand for soybean meal may be facilitated by a decrease in soybean processing volumes in the United States, in September 2021, to 4.92 million tons. This is 2.6% less than in August of this year and 4% less than in September 2020. The volume of processing of soybeans as a food for farm animals (meal produced for animal feed) amounted to 3.59 million tons in September 2021, which is 4.2% less than the same period last year. An important factor in the rise in prices for soybeans may also be the rise in world prices for fertilizers and fuel for agricultural machinery. It should also be noted that according to the USDA, China may increase its soybean imports in 2021 by 2%.
Want to get more free analytics? Open Demo Account now to get daily news and analytical materials.
Want to get more free analytics? Open Demo Account now to get daily news and analytical materials.
Author

Dmitry Lukashov
IFC Markets
Dimtry Lukashov is the senior analyst of IFC Markets. He started his professional career in the financial market as a trader interested in stocks and obligations.


