|

Soybean Elliott Wave technical analysis [Video]

Soybean Elliott Wave analysis

The bounce from August appears to have completed as the commodity now aims for a new low for the year. Thus, the bearish sequence from June 2022 should extend lower.

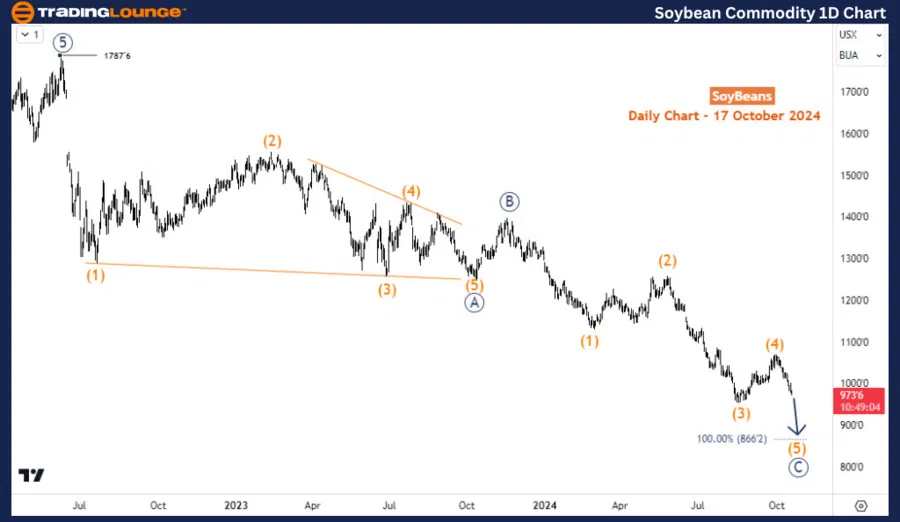
The price is in a bearish corrective phase on the daily chart - correcting the impulse wave cycle between May 2019 and June 2022. From the high of June 2022, we can expect a 3-wave structure at least. Wave ((A)) ended in October 2023 with a diagonal structure before a shallow bounce for wave ((B)) followed to the high of November 2023. Since November, a bearish impulse wave has evolved for wave ((C)). Price completed wave (4) of ((C)) in September 2024 as a sell-off for wave (5) of ((C)) followed. Wave (5) could extend to 866-661 before another recovery begins.

Alternatively, the decline from the June 2022 high ($1787) could also be an impulse structure if the price exceeds 535. In either case, the downside is very much favored to continue in the coming weeks.

Chart

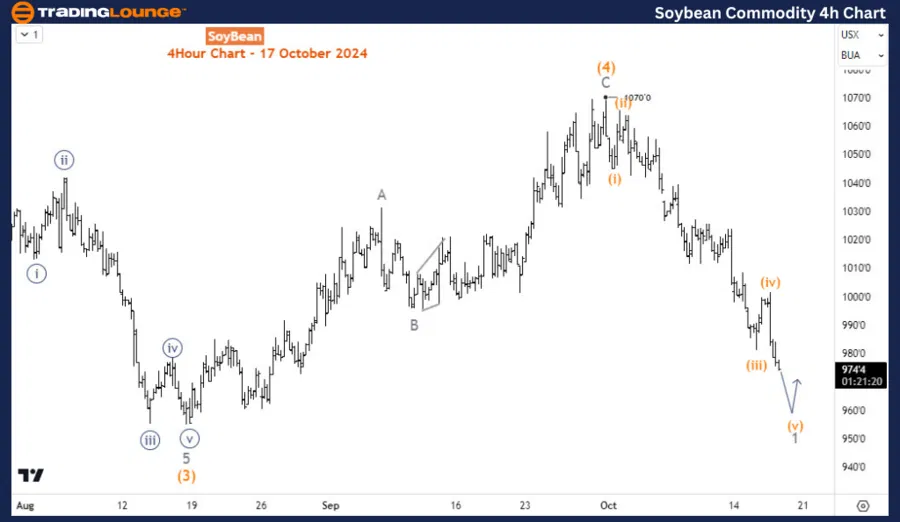
On the H4 chart, it appears the price is still in wave 1 of (5). This means traders should focus on selling bounces. Decline will most likely breach 866 and run to 661 before completing the impulse wave for (5) of((C)).

Chart

Soybean Elliott Wave technical analysis [Video]

Author

Peter Mathers

Peter Mathers

TradingLounge

Peter Mathers started actively trading in 1982. He began his career at Hoei and Shoin, a Japanese futures trading company.

More from Peter Mathers
Share:

Editor's Picks

EUR/USD hits two-day highs near 1.1820

EUR/USD picks up pace and reaches two-day tops around 1.1820 at the end of the week. The pair’s move higher comes on the back of renewed weakness in the US Dollar amid growing talk that the Fed could deliver an interest rate cut as early as March. On the docket, the flash US Consumer Sentiment improves to 57.3 in February.

GBP/USD reclaims 1.3600 and above

GBP/USD reverses two straight days of losses, surpassing the key 1.3600 yardstick on Friday. Cable’s rebound comes as the Greenback slips away from two-week highs in response to some profit-taking mood and speculation of Fed rate cuts. In addition, hawkish comments from the BoE’s Pill are also collaborating with the quid’s improvement.

Gold climbs further, focus is back to 45,000

Gold regains upside traction and surpasses the $4,900 mark per troy ounce at the end of the week, shifting its attention to the critical $5,000 region. The move reflects a shift in risk sentiment, driving flows back towards traditional safe haven assets and supporting the yellow metal.

Crypto Today: Bitcoin, Ethereum, XRP rebound amid risk-off, $2.6 billion liquidation wave

Bitcoin edges up above $65,000 at the time of writing on Friday, as dust from the recent macro-triggered sell-off settles. The leading altcoin, Ethereum, hovers above $1,900, but resistance at $2,000 caps the upside. Meanwhile, Ripple has recorded the largest intraday jump among the three assets, up over 10% to $1.35.

Three scenarios for Japanese Yen ahead of snap election

The latest polls point to a dominant win for the ruling bloc at the upcoming Japanese snap election. The larger Sanae Takaichi’s mandate, the more investors fear faster implementation of tax cuts and spending plans. 

XRP rally extends as modest ETF inflows support recovery

Ripple is accelerating its recovery, trading above $1.36 at the time of writing on Friday, as investors adjust their positions following a turbulent week in the broader crypto market. The remittance token is up over 21% from its intraday low of $1.12.