Soybean Elliott Wave analysis

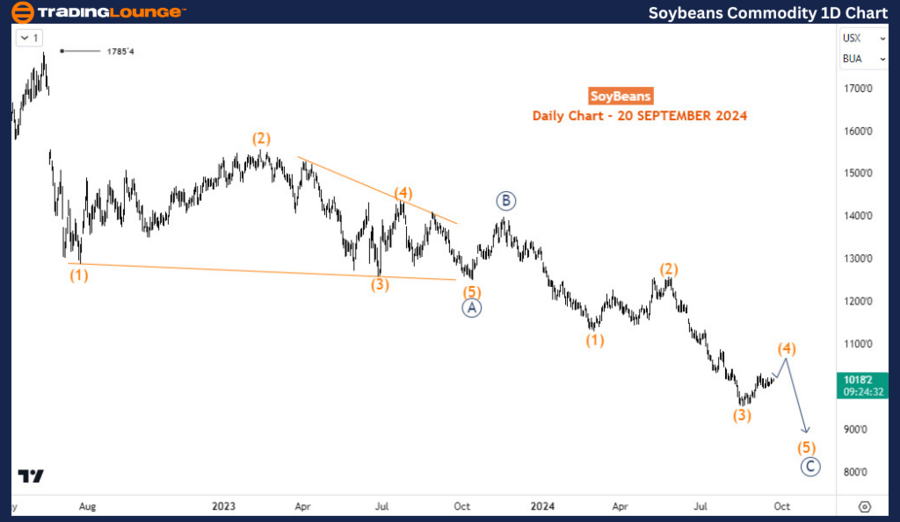
The soybean market is currently retracing within a long-term corrective structure that has developed since the peak in June 2022. While short-term upside potential appears likely, the overarching trend suggests that a significant sell-off is poised to resume, potentially driving prices toward the lows seen in 2020.

Long-term perspective

Before the decline that began in June 2022, soybeans experienced a robust bullish impulse wave starting in May 2019, which propelled prices from approximately $806 to significant highs. However, over the past 26 months, the market has surrendered more than two-thirds of those gains. From an Elliott Wave standpoint, the current corrective phase is forming a three-swing pattern, a typical structure within corrective waves that indicates a complex retracement.

Daily chart analysis

On the daily chart, we observe this corrective structure unfolding at the primary wave degree. Wave A reached its conclusion at $1,249 in October 2023, followed by Wave B, which peaked at $1,398 in November 2023. Presently, we are witnessing the formation of Wave C to the downside. Within this unfolding Wave C, sub-waves (1), (2), and (2) of 5 have already been completed. The market is now experiencing a retracement in Wave (4), currently trading above the significant level of $1,000. A key question arises: how high can this Wave (4) rally extend?

Chart

Four-hour chart analysis

Zooming into the H4 chart, we find that Wave (4) has completed its first sub-wave, denoted as Wave A. The bullish reaction observed since September 11, 2024, suggests that Wave B may have concluded. For confirmation that Wave B has indeed ended and that we are transitioning into Wave C, the price must break above the high of Wave A. Should this scenario play out, we could expect Wave C to advance toward the $1,070 level. Alternatively, if the price fails to surpass the high of Wave A, it may indicate that Wave B is set to make another minor leg down, dipping slightly below $1,000 before establishing a solid support base to initiate Wave C.

Soybean

Soybean Elliott Wave technical analysis [Video]

As with any investment opportunity there is a risk of making losses on investments that Trading Lounge expresses opinions on.

Historical results are no guarantee of future returns. Some investments are inherently riskier than others. At worst, you could lose your entire investment. TradingLounge™ uses a range of technical analysis tools, software and basic fundamental analysis as well as economic forecasts aimed at minimizing the potential for loss.

The advice we provide through our TradingLounge™ websites and our TradingLounge™ Membership has been prepared without considering your objectives, financial situation or needs. Reliance on such advice, information or data is at your own risk. The decision to trade and the method of trading is for you alone to decide. This information is of a general nature only, so you should, before acting upon any of the information or advice provided by us, consider the appropriateness of the advice considering your own objectives, financial situation or needs. Therefore, you should consult your financial advisor or accountant to determine whether trading in securities and derivatives products is appropriate for you considering your financial circumstances.

Recommended Content


Recommended Content

Editors’ Picks

AUD/USD: The hunt for the 0.7000 hurdle

AUD/USD: The hunt for the 0.7000 hurdle

AUD/USD quickly left behind Wednesday’s strong pullback and rose markedly past the 0.6900 barrier on Thursday, boosted by news of fresh stimulus in China as well as renewed weakness in the US Dollar.

AUD/USD News
EUR/USD refocuses its attention to 1.1200 and above

EUR/USD refocuses its attention to 1.1200 and above

Rising appetite for the risk-associated assets, the offered stance in the Greenback and Chinese stimulus all contributed to the resurgence of the upside momentum in EUR/USD, which managed to retest the 1.1190 zone on Thursday.

EUR/USD News
Gold holding at higher ground at around $2,670

Gold holding at higher ground at around $2,670

Gold breaks to new high of $2,673 on Thursday. Falling interest rates globally, intensifying geopolitical conflicts and heightened Fed easing bets are the main factors. 

Gold News
Bitcoin displays bullish signals amid supportive macroeconomic developments and growing institutional demand

Bitcoin displays bullish signals amid supportive macroeconomic developments and growing institutional demand

Bitcoin (BTC) trades slightly up, around $64,000 on Thursday, following a rejection from the upper consolidation level of $64,700 the previous day. BTC’s price has been consolidating between $62,000 and $64,700 for the past week.

Read more
RBA widely expected to keep key interest rate unchanged amid persisting price pressures

RBA widely expected to keep key interest rate unchanged amid persisting price pressures

The Reserve Bank of Australia is likely to continue bucking the trend adopted by major central banks of the dovish policy pivot, opting to maintain the policy for the seventh consecutive meeting on Tuesday.

Read more
Five best Forex brokers in 2024

Five best Forex brokers in 2024

VERIFIED Choosing the best Forex broker in 2024 requires careful consideration of certain essential factors. With the wide array of options available, it is crucial to find a broker that aligns with your trading style, experience level, and financial goals. 

Read More

Majors

Cryptocurrencies

Signatures