Soybean Elliott Wave analysis

The long-term bearish cycle for soybeans, which began in June 2022, continues to push prices lower, currently trading near a four-year low. The downtrend shows no signs of a major reversal, and investors are likely to continue selling on rallies until a definitive bottom is reached. Technically, no significant reversal signals have been identified, indicating that the bearish trend may persist.

Long-term perspective

Before the June 2022 decline, soybeans completed a bullish impulse wave that started in May 2019, lifting prices from $806. However, over the past 26 months, more than two-thirds of those gains have been wiped out. From an Elliott Wave perspective, the current corrective phase is developing into a three-swing pattern, a common structure in corrective waves.

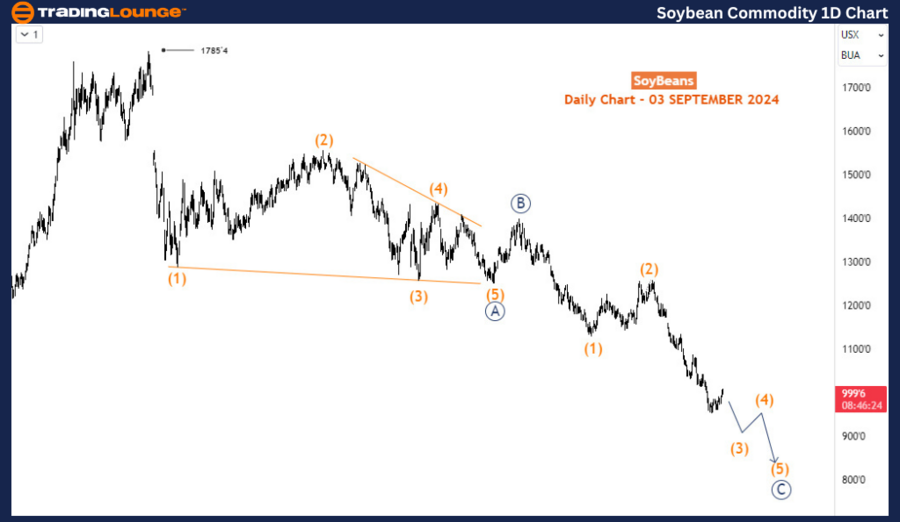
Daily chart analysis

On the daily chart, the corrective pattern is analyzed from the primary wave degree (circled). Wave A (circled) concluded at $1,249 in October 2023, followed by Wave B (circled), which ended at $1,398 in November 2023. Wave C (circled) is currently unfolding to the downside. Within this wave, sub-waves (1) and (2) of 5 (circled) have already been completed, and the price is now advancing in Wave (3). The price has broken below the critical $1,000 level and could potentially drop to $800 before Wave (3) completes. This movement is part of Wave 5 of (3), suggesting that the bearish phase is not yet over. In the near term, further downward pressure is anticipated.

SOYBEAN

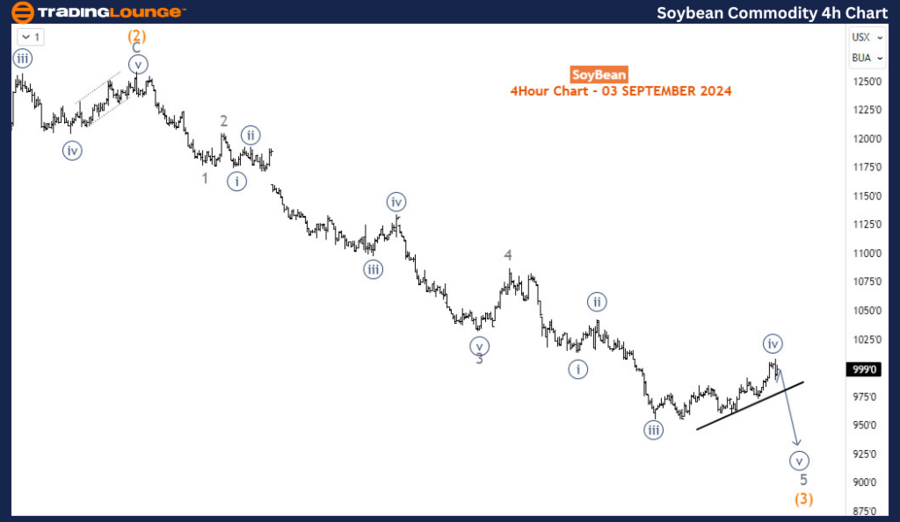
Four-hour chart analysis

On the H4 chart, Wave 5 is in a temporary bounce for the 4th sub-wave, labeled as Wave iv (circled) of 5. This indicates that after this brief upward correction, soybeans are likely to resume their downward trajectory, continuing the sell-off. The broader bearish trend remains intact, with additional declines expected as the market completes its ongoing corrective phase.

Soybean

Soybean Elliott Wave technical analysis [Video]

As with any investment opportunity there is a risk of making losses on investments that Trading Lounge expresses opinions on.

Historical results are no guarantee of future returns. Some investments are inherently riskier than others. At worst, you could lose your entire investment. TradingLounge™ uses a range of technical analysis tools, software and basic fundamental analysis as well as economic forecasts aimed at minimizing the potential for loss.

The advice we provide through our TradingLounge™ websites and our TradingLounge™ Membership has been prepared without considering your objectives, financial situation or needs. Reliance on such advice, information or data is at your own risk. The decision to trade and the method of trading is for you alone to decide. This information is of a general nature only, so you should, before acting upon any of the information or advice provided by us, consider the appropriateness of the advice considering your own objectives, financial situation or needs. Therefore, you should consult your financial advisor or accountant to determine whether trading in securities and derivatives products is appropriate for you considering your financial circumstances.

Recommended Content


Recommended Content

Editors’ Picks

EUR/USD extends losses below 1.1050, US PMIs awaited

EUR/USD extends losses below 1.1050, US PMIs awaited

EUR/USD resumes the downside toward 1.1000 in the European session on Tuesday. The pair stays on a slippery slope, courtesy of the sustained US Dollar recovery and a souring market mood, ahead of the ISM Manufacturing PMI data.

EUR/USD News
GBP/USD closes in on 1.3100 ahead of US PMI data

GBP/USD closes in on 1.3100 ahead of US PMI data

GBP/USD stays under bearish pressure on Tuesday, closing in on 1.3100. A fresh US Dollar uptick and a risk-averse market environment bode ill for the pair, as traders shift their focus to the US ISM manufacturing PMI data for August.

GBP/USD News
Gold falls to weekly low below $2,500

Gold falls to weekly low below $2,500

Gold continues to stretch lower on Tuesday and trades at its weakest level in a week below $2,490. The benchmark 10-year US Treasury bond yield holds comfortably above 3.9% ahead of US data, making it difficult for XAU/USD to hold its ground.

Gold News
Bitcoin and Ethereum whale activity declines 50% while BTC, ETH accumulation continues

Bitcoin and Ethereum whale activity declines 50% while BTC, ETH accumulation continues

Bitcoin and Ethereum whale activity has slowed down since mid-March 2024 when it hit its peak this year. In March 2024, Bitcoin and Ethereum prices hit a peak of $73,777 and $4,093. The two largest cryptocurrencies have noted a correction in their prices since then. 

Read more
Week ahead: US labour data and the BoC rate announcement in focus

Week ahead: US labour data and the BoC rate announcement in focus

With US Federal Reserve Chair Jerome Powell’s recent speech at the Jackson Hole Symposium confirming that it is time to begin easing policy as well as underlining the importance of the jobs market, this week’s jobs data may help determine how the Fed approaches its easing cycle.

Read more
Moneta Markets review 2024: All you need to know

Moneta Markets review 2024: All you need to know

VERIFIED In this review, the FXStreet team provides an independent and thorough analysis based on direct testing and real experiences with Moneta Markets – an excellent broker for novice to intermediate forex traders who want to broaden their knowledge base.

Read More

Majors

Cryptocurrencies

Signatures