So many odd coincidences – Do they mean anything?

Market prices fluctuate on cycles and human emotions; thus, patterns tend to matter. Moreover, history often repeats itself or at least rhymes. We have noted similarities between the current environment and the financial crisis all year. As time progresses, the similarities become more plentiful and precise. Does this mean we will fall into the same depths of despair felt in 2007/2008? Will we get off with a much less severe economic reset? Or will we proceed with history's largest asset value expansion without any hiccups? We won't know until we know, but all I can say is we will need to be on our toes and take the prospective risks seriously. Further, I believe this is a time to play defense, not offense.
Here are some noticeable similarities between what we are seeing and what we saw before and during the financial crisis.
• In the big picture, just as we were in 2007/08, the market was near an all-time high, the unemployment rate was comfortably under 5%, real estate was hot, homeowners were taking loans against their equity, and every day people were quitting their jobs to day trade. We were told the economy was booming and everything was fine. Analysts were making bold statements such as "There isn't a recession in sight." However, there were signs of turmoil bubbling under the surface. For example, accounting irregularity stories started to emerge, and Boeing employees went on strike in September of 2008, ahead of a heated election season. Does this sound familiar?
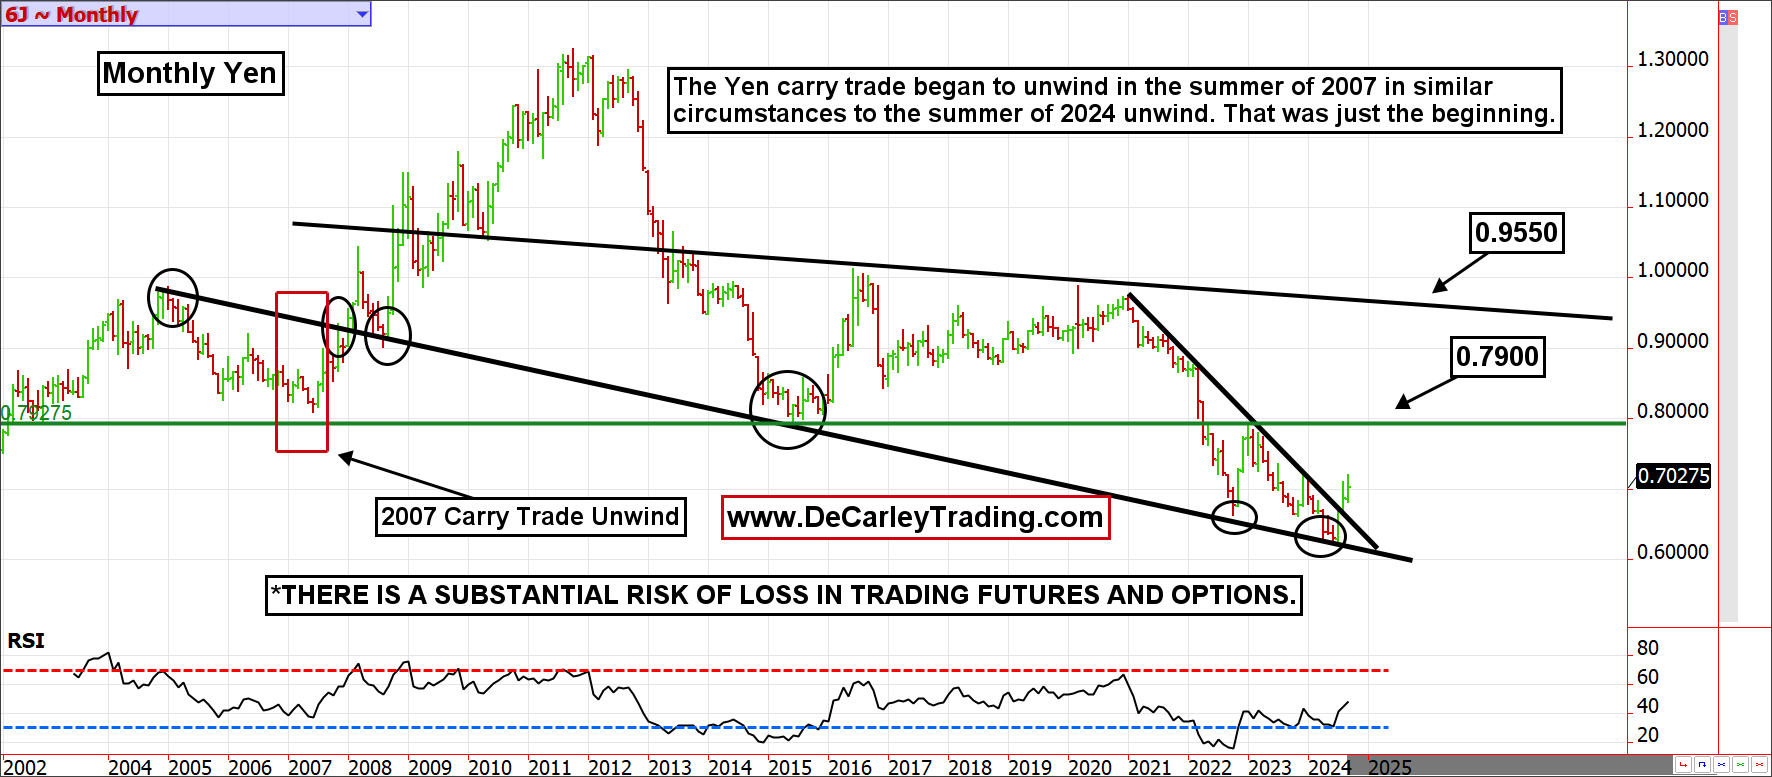
• The most obvious comparison is the unwinding of the yen carry trade, which lit the fire for the financial crisis fire in 2007. The equity market corrected immediately but never fully recovered its uptrend and eventually experienced a 50% correction. We are currently in the 2nd or 3rd inning of the game, so we don't yet know if this is a replay.
• On September 18th, 2024, the Fed began a rate-cutting cycle with a rare 50 basis point cut. In 2007, the rate-cutting cycle also began on September 18th at a pace of 50 basis points.
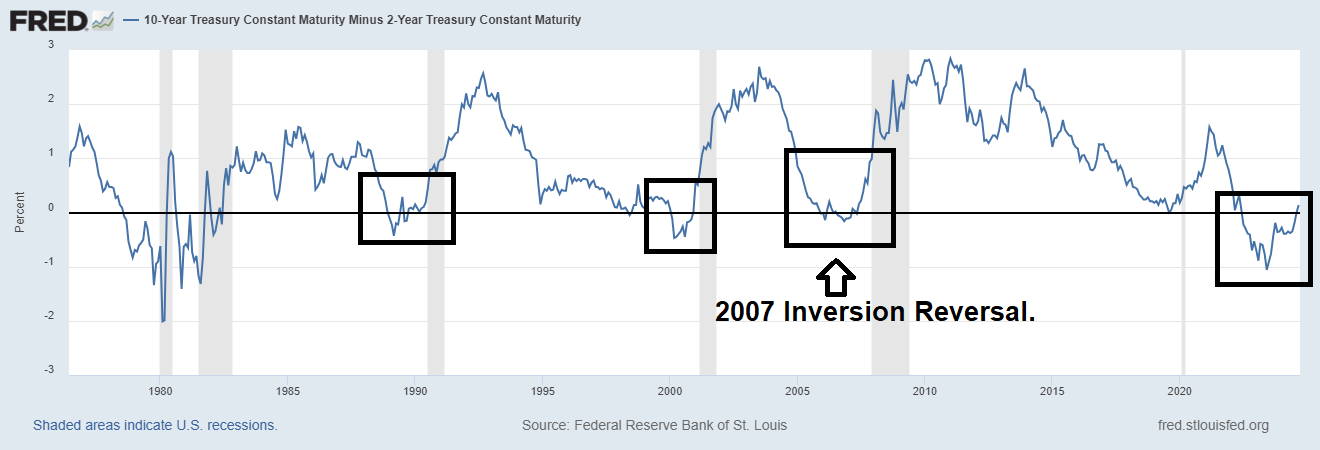
• A prolonged yield curve inversion was uninverted in the summer of 2007. We've also seen a prolonged yield curve inversion go positive in the summer of 2024. This chart depicts this occurrence in 2007; the blue line represents the spread between the 10-year and 2-year note Treasuries. When the spread goes negative (below the black line), it is said to be inverted. This has historically been a precursor to recessions (grey bars), but the recession often comes months after the curve moves back into positive territory. Will this time be different? It isn't likely.
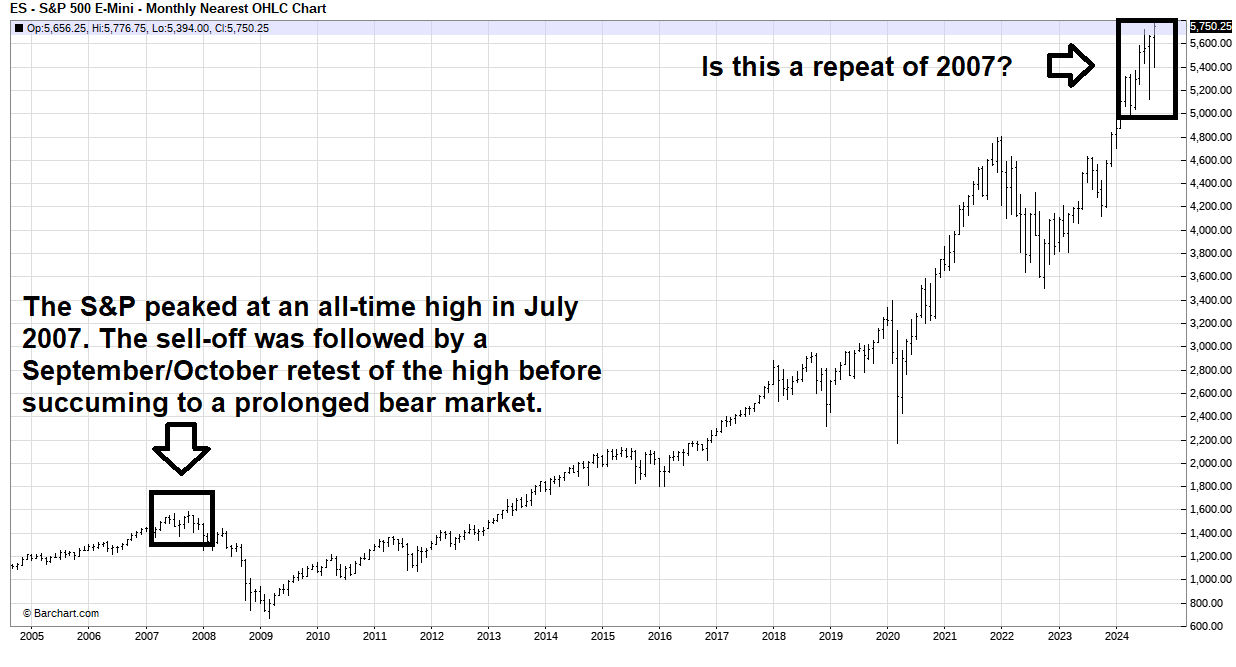
• The S&P posted a high print in July 2007, followed by a September/October recovery that fell short and succumbed to selling. Is this what we are seeing now?
• Like 2024, 2008 was an election year. Going into the election, the market was already down about 25% from the previous year's highs and had given another 25% before bottoming in March of 2009. Will the 2024 election season bring a large equity market correction?
The stock market is designed to go up over time; therefore, it doesn't pay to be a perma-bear. On the contrary, I am generally better described as a perma-bull. However, I try to keep myself grounded in reality, and there are too many red flags to be complacent. On rare occasions, the equity market experiences gut-wrenching blows to the bulls, and there has been a precedence for decades of lost stock returns in the US. Ignoring dividends, the S&P Dot Com bubble peak wasn't surpassed until thirteen years later. It is not impossible to argue that in 2024, we have pulled forward equity market prosperity and will need time to catch up with the math as it needed to in the early 2000s.
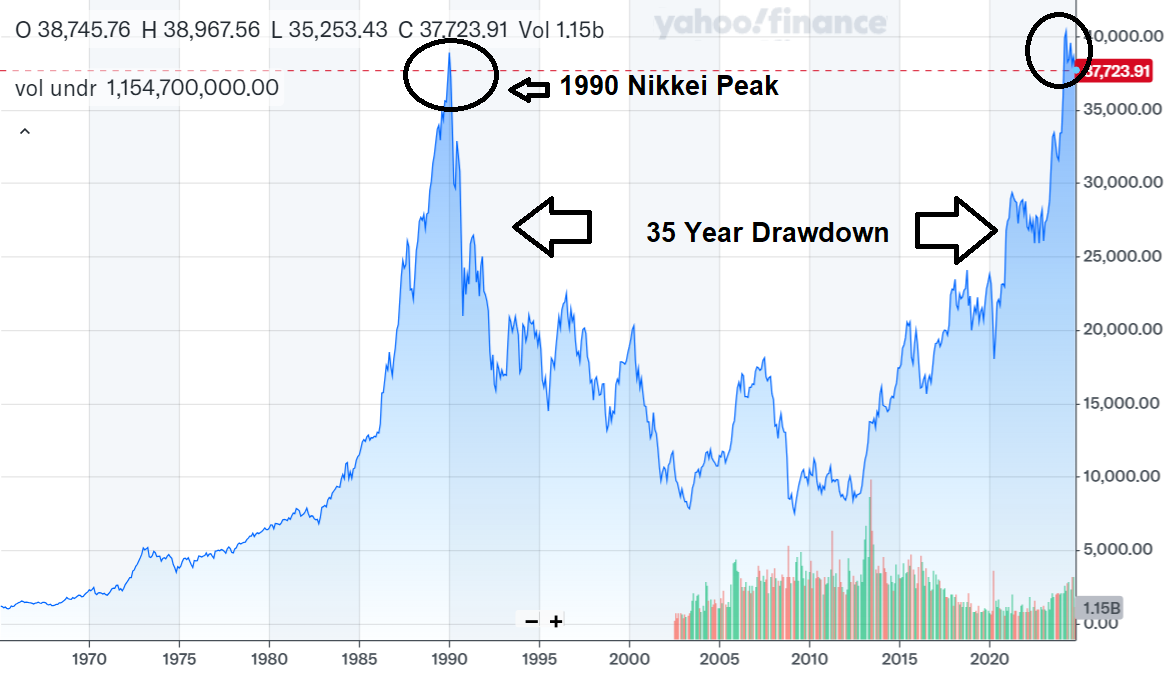
A long-term chart of the primary Japanese stock index, the Nikkei 225, is even more eye-opening. While our central bankers haven't been as aggressively creative as the Bank of Japan, they have employed many of the same tactics. The Nikkei 225 exploded higher in the 1980s to peak in 1990 at just under 40,000, a level that wasn't seen again until this year (almost 35 years later).
I'm not trying to scare anyone; I am just trying to point out that there is a substantial risk of loss when participating in financial markets, even when nobody seems to behave as if there is. Ignoring history doesn't change it, nor does it prevent it from repeating.
Author

Carley Garner
DeCarley Trading
Carley Garner is an experienced commodity broker with DeCarley Trading, a division of Zaner, in Las Vegas, Nevada. She is also the author of multiple books including, “Higher Probability Commodity Trading” and “A Trader's First Book on Commodities”.


