Silver’s upside target: Almost there

We’re almost at the targets – in case of multiple markets. And we got other signs, too. The trend is likely about to change.
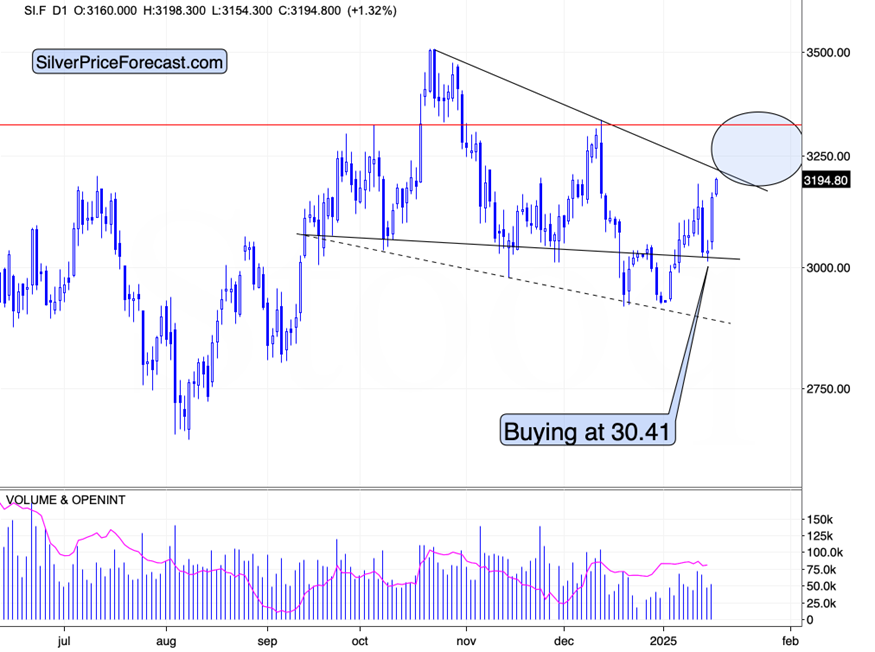
Silver is up over $1.5 since we bought it – not bad for a two-day trade, is it? If one kept repeating this performance throughout the entire year, they would multiply their capital 479 times. Of course, that’s not realistic, but it does show that focusing on this trade was well worth the time. The truth is, however, that this trade is not yet over, and we need to focus on taking the profits at the right place and at the right time.
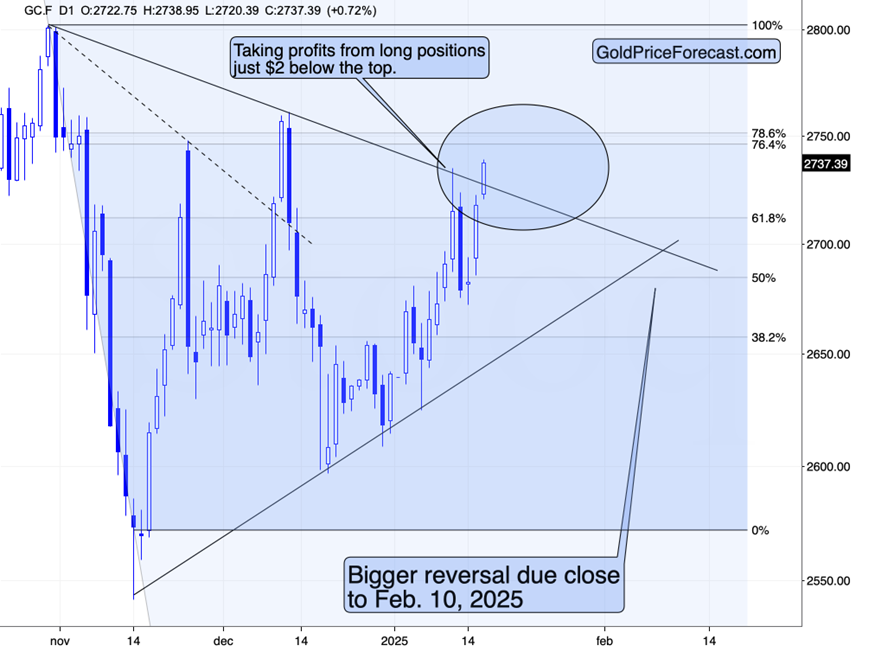
Gold just moved above its declining resistance line (and those who own gold are likely happy about it, in particular if they are gaining extra passive income from it), and it remains below its two recent highs as well as the 76.4% and 78.6% Fibonacci retracement levels.
I don’t care that much about gold’s breakout above the declining resistance line as when it moved above its previous analogous line – in December – that was right before it topped. Or I might say that I do care about it as it’s yet another “watch out, the top might be very close” sign, not a simple “buy signal” that the classic technical analysis workbook might have suggested.
Silver’s fake breakouts
On a side note, whatever the technical rule is, before applying it, be sure to check if it actually worked on the market that you’re analyzing. For example, since silver is known for fake breakouts, seeing a breakout there should NOT be viewed as a buy signal. (That’s one of the reasons why silver is a very difficult market to trade for beginners.)
Putting things into perspective… We are in a situation where multiple other markets are also about to reach their resistance level – or they have already done so. Since markets are connected, it’s quite often the case that we can infer something about one market while looking at the other. Sometimes it makes sense fundamentally (gold stocks and gold; commodity stocks and commodities, gold and silver), and sometimes it doesn’t (the contagion effect that can make various emerging markets fall at the same time even though their economies are not that connected).
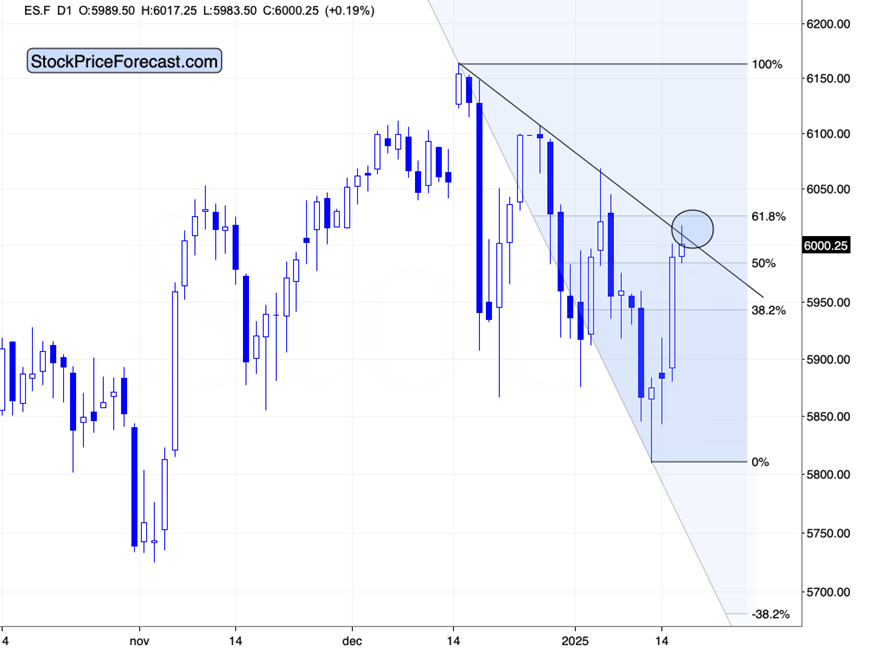
The S&P 500 Index futures just moved to their declining resistance line, and they almost touched their 61.8% Fibonacci retracement level. This is a strong technical resistance as both techniques support it.
The top might be on, or perhaps the index itself (which is not trading yet) might need to reach analogous levels. As it’s already happening in the futures, so it’s easily achievable in the index as well.
As the index futures didn’t reach the 61.8% retracement and the index itself is not trading yet, I view this as an “almost there” situation.
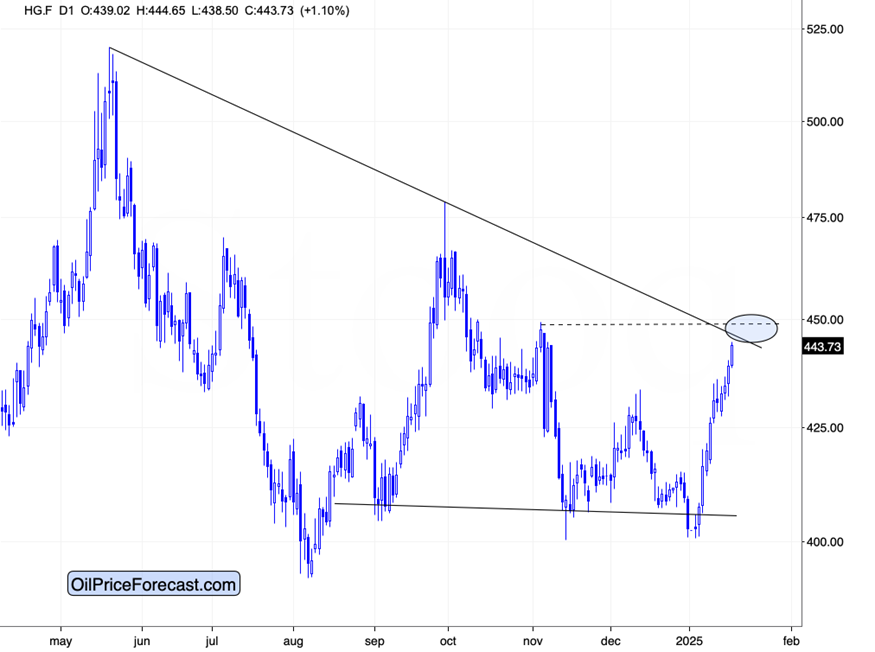
In case of copper futures, the “almost there” is even clearer. Copper rallied once again today and it’s very close to touching the declining resistance line and the November high. Will this level hold? Most likely yes.
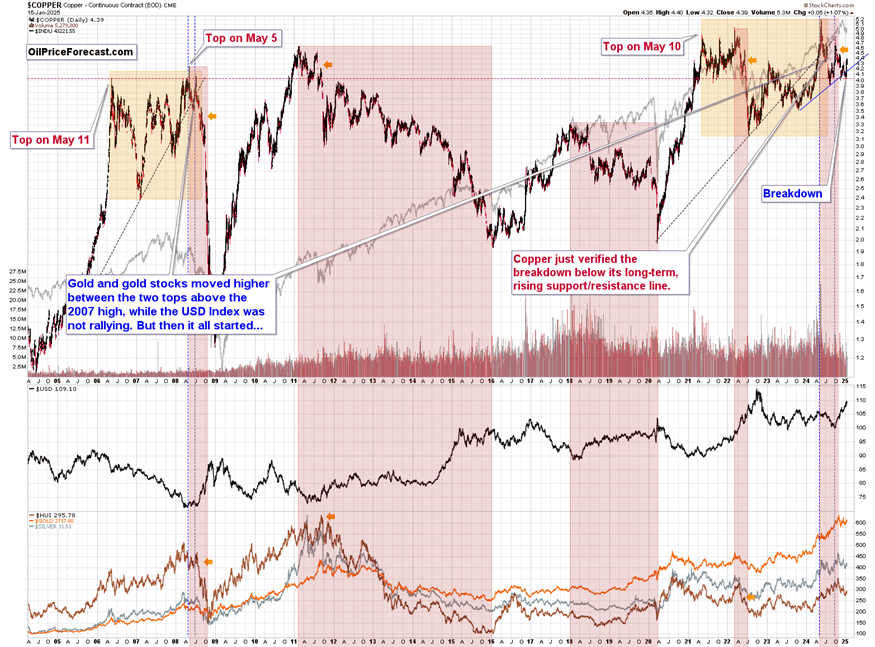
From the long-term point of view, this is not the first time copper is bouncing from the 4.0 level. We saw something similar in early 2011 (twice – the first rebound was big, and the latter was just sharp) and in 2022.
This is the second rebound from this level that we see after copper formed its all-time high, and it’s something in tune with what we saw in 2011. This rebound didn’t end the decline – it was just a bull trap.
Copper failed to hold above its 2021 and 2011 highs, which makes it likely to slide in the following months. Rising long-term interest rates support this scenario.
A Potential market turnaround
Also, in the previous months (and years), I’ve been writing about the phenomenon, where the weakest parts of a given market (usually weakest stocks – it’s simply a matter of what they are weak in comparison to) perform surprisingly well in the final moments of a given rally. The reason is that the investment public tends to buy close to the tops and they are inclined to buy cheap things without considering that they might be cheap for a reason.
FCX and NEM have been weak in recent months and guess what they just did?
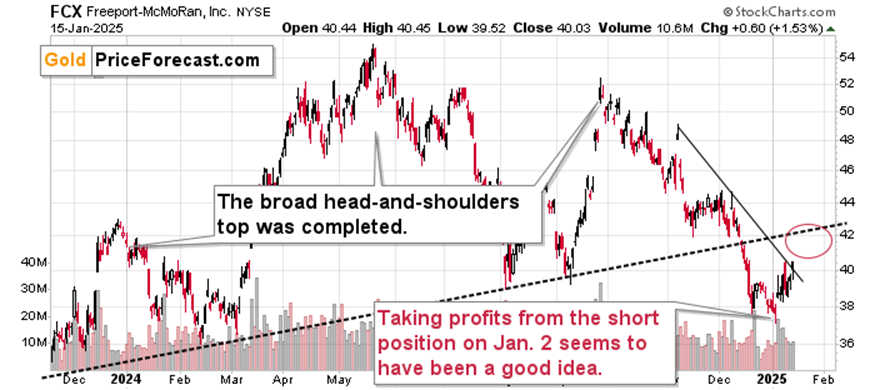
They both rallied.
FCX finally broke above its declining resistance line, which – given the overnight rally in copper – is likely to lead to an additional daily gain.
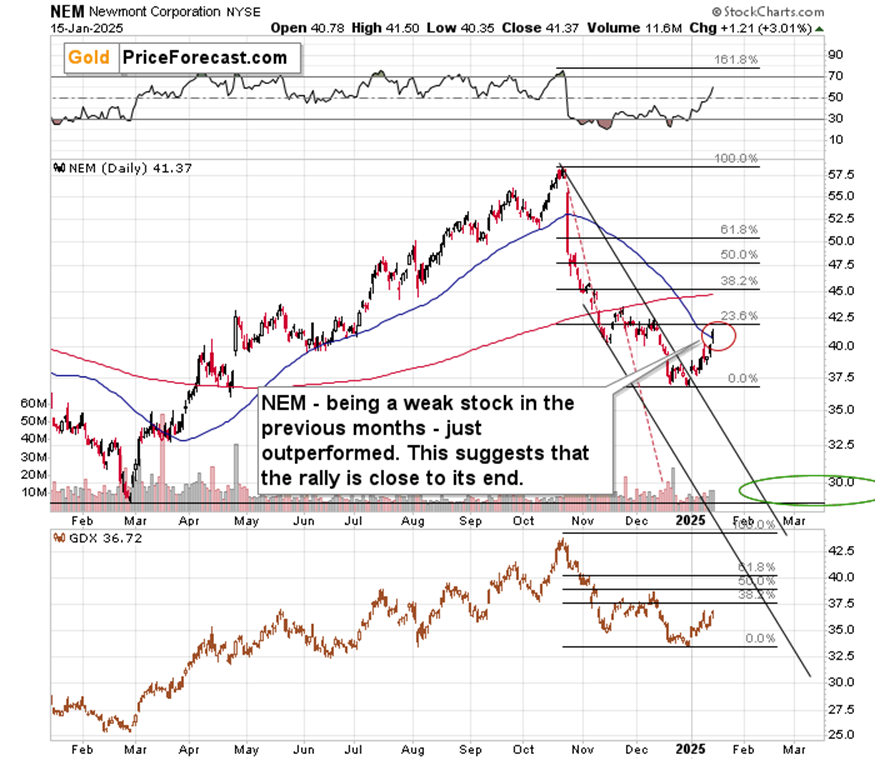
NEM just soared by over 3% yesterday and it almost reached its 23.6% Fibonacci retracement.
The laggards are strong, and this is a warning sign.
Combining this with markets close to their targets provides us with a good chance that we’re about to see a turnaround.
Want free follow-ups to the above article and details not available to 99%+ investors? Sign up to our free newsletter today!
Author

Przemysław Kwiecień, PhD CFA
XTB Poland
Chief economist at X-Trade Brokers, European brokerage house based in Poland. Doctor of Economics obtained at University of Warsaw, graduated from Warsaw University and London Metropolitan University (M.Sc. degree) - both graduated with honors.


