Silver Elliott Wave technical analysis [Video]
![Silver Elliott Wave technical analysis [Video]](https://editorial.fxstreet.com/images/Markets/Commodities/Metals/Silver/silver-coin-and-bullion-bar-21936522_XtraLarge.jpg)
Silver Elliott Wave analysis
Function - Counter-Trend.
Mode - Corrective.
Structure - Expected Impulse or Zigzag for wave C (circled).
Position - Wave 1 of (1).
Direction - Wave 2 of (1) of C (circled).
Details - It appears wave B (circled) has been completed and wave C (circled) is now emerging upside. We are now counting a pullback in wave 2 of (1) or wave (2).
The current dynamics in the silver market present an intriguing opportunity. Silver is recovering from a pullback that began in late May 2024, and this recovery is expected to ignite a series of rallies, continuing the year-long bullish impulse cycle. Both long-term and medium-term Elliott Wave forecasts support the potential for further upward movement in this precious metal.
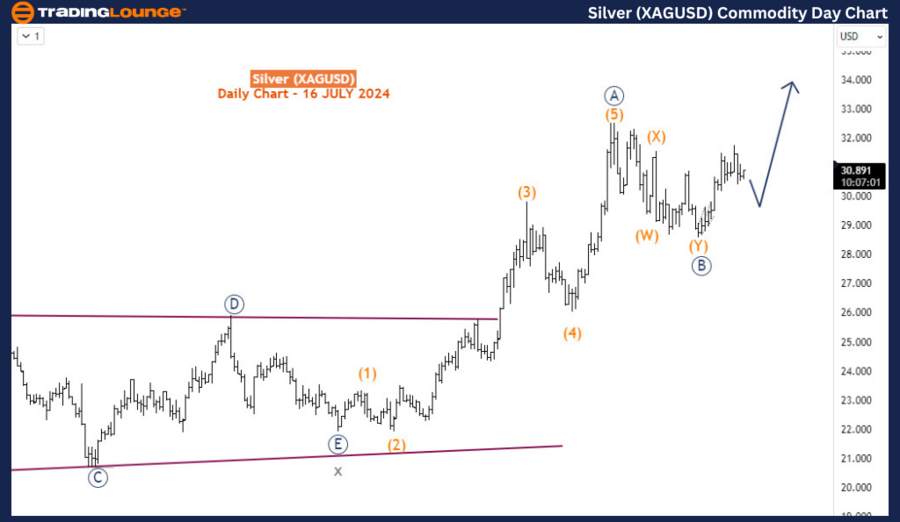
Daily chart Analysis
On the daily chart, we can observe that the impulse wave sequence, which began in January 2024, culminated in May 2024, followed by a corrective pullback. This bearish corrective structure persisted for five weeks and appears to have concluded with a double zigzag pattern. The shallowness of this correction suggests a potential for another leg lower. However, if the impulsive reaction from late June continues to ascend without turning corrective, it would confirm that the market has embraced the shallow nature of the pullback. This scenario is likely to propel silver prices higher, potentially reaching new highs in 2024.
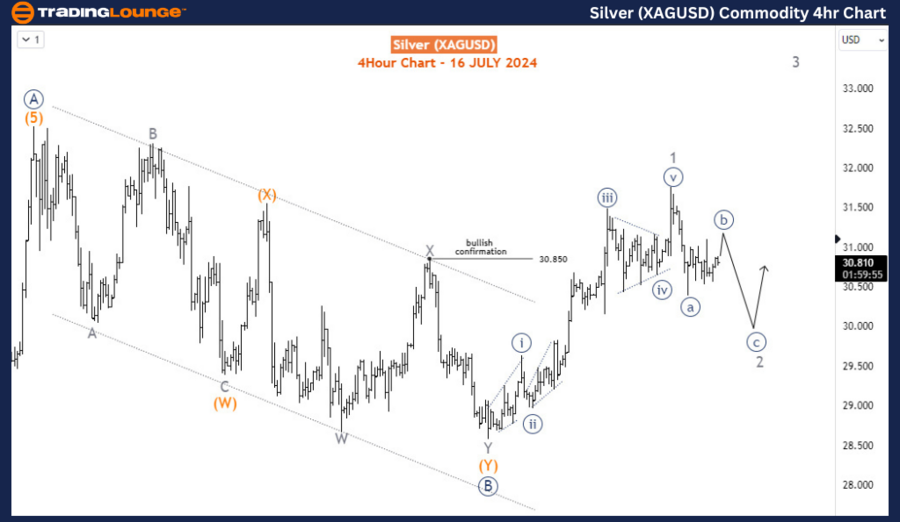
Four-hour chart analysis
The H4 chart provides a closer look at the sub-waves of wave B (circled) and the early stages of wave C (circled). The price appears to have completed wave 1 of C (circled) at 31.75 and is currently undergoing a pullback in wave 2. Wave 2 could potentially extend lower to the 30.15-29.77 range, which represents the 50-61.8% Fibonacci retracement levels. This zone is where the price could find support, setting the stage for the commencement of wave 3, which is anticipated to drive silver to fresh highs in 2024.
It is crucial to monitor that the price remains above 28.57, as a break below this level would indicate that wave B might extend lower, altering the expected bullish trajectory.
Summary
In summary, the Elliott Wave analysis suggests that silver is in the midst of a recovery from a recent pullback, with the potential for significant rallies ahead. The key levels to watch include the 30.15-29.77 range for wave 2 support and 28.57 as a critical support level. If the current impulse wave continues to rise, it will confirm the shallow nature of the pullback and support the projection of new highs for silver in 2024. This analysis underscores the importance of closely monitoring wave structures and key price levels to anticipate future movements in the silver market.
Silver Elliott Wave technical analysis [Video]
Author

Peter Mathers
TradingLounge
Peter Mathers started actively trading in 1982. He began his career at Hoei and Shoin, a Japanese futures trading company.


