Silver Elliott Wave technical analysis [Video]
![Silver Elliott Wave technical analysis [Video]](https://editorial.fxstreet.com/images/Markets/Commodities/Metals/Silver/sterling-silver-46984604_XtraLarge.jpg)
Silver Elliott Wave analysis
Function - Counter-Trend.
Mode - Corrective.
Structure -Double Zigzag for wave B (circled).
Position - Wave (Y) of B.
Direction - Wave (Y) of B is still in play.
Details - After violating the last update, we have a new outlook on daily and H4 that better fits the current price action. A lower extension is now expected for Silver.
Silver Elliott Wave Analysis: Extended Decline and Bullish Outlook
Overview
The decline in Silver that began on May 20th is continuing to extend lower and is expected to persist before finding significant support. Despite this downturn, the year-long trend remains bullish and is anticipated to resume once this corrective phase concludes. The emerging chart pattern suggests a further decline towards $27 in the coming days or weeks.
Daily chart analysis
Two key observations can be made on the daily chart:
-
Bullish Yearly Trend: The trend for this year has been bullish, leading to a breakout from a prior 13-month sideways price action. This indicates strong underlying bullish momentum.
-
Corrective Decline: The current decline from April 19th, 2024, is identified as corrective. Therefore, the expectation is that the bullish trend will resume once this corrective structure concludes.
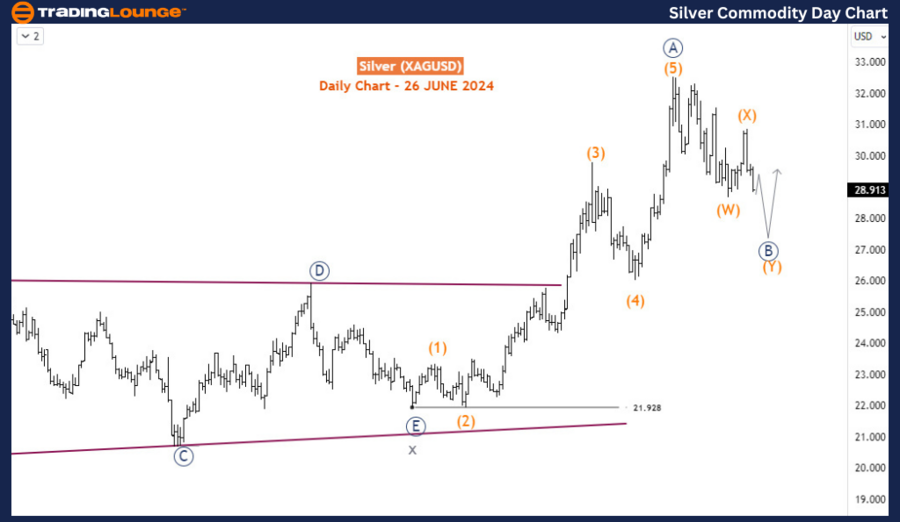
To determine when the corrective structure will finish, it’s important to identify the emerging pattern. Early analysis suggests that the price might be forming a double zigzag Elliott wave corrective structure, labeled as waves (W)-(X)-(Y). Wave (W) and wave (X) completed on June 13th and June 21st, respectively. The price is now breaking down in wave (Y), which could extend to $27 or lower. Meanwhile, the year-long impulse is labeled as wave A (circled) in the primary degree, and the double zigzag pullback should complete the corresponding primary degree wave B (circled). Following this, wave (C) is expected to push the price to a fresh 2024 high.
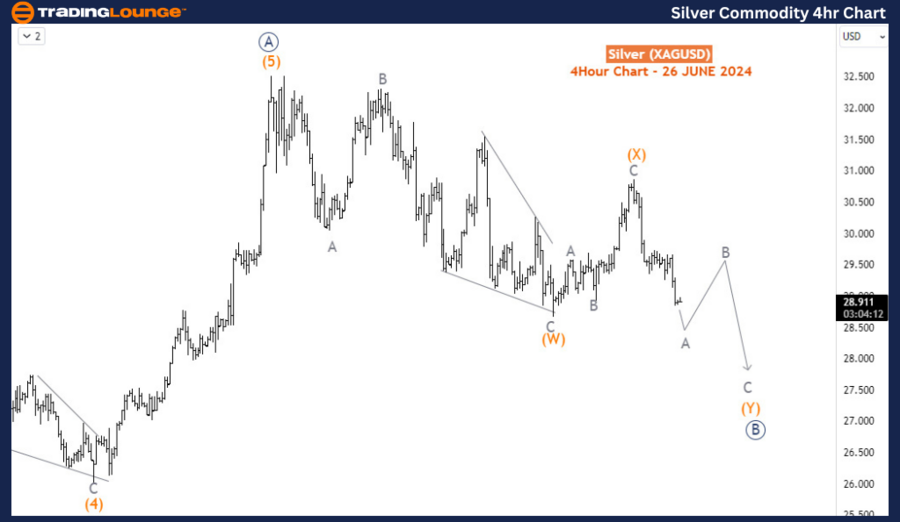
Four-hour chart analysis
The H4 chart provides a detailed view of the sub-waves within the double zigzag structure. The price is currently in wave A of (Y), which is expected to be followed by a minor corrective bounce for wave B. Afterward, the price should continue lower for wave C, completing wave (Y) of B (circled). This pattern aligns with the broader expectation of a corrective phase before the resumption of the bullish trend.
Summary
- Current Decline: Silver’s decline from May 20th is expected to continue towards $27 before finding support.
-
Bullish Yearly Trend: Despite the current downturn, the overall trend for the year remains bullish.
-
Corrective Structure: The decline is forming a double zigzag Elliott wave corrective structure.
-
Daily Chart Insight: The trend is expected to resume higher after the completion of the current wave B.
-
H4 Chart Detail: Sub-waves show a minor bounce expected before a further decline to complete wave (Y) of B.
In conclusion, while Silver is currently experiencing a corrective decline, the long-term bullish trend is anticipated to resume once this phase concludes. Traders should watch for a potential bottom around $27 and prepare for a renewed bullish impulse towards new highs in 2024.
Silver Elliott Wave technical analysis [Video]
Author

Peter Mathers
TradingLounge
Peter Mathers started actively trading in 1982. He began his career at Hoei and Shoin, a Japanese futures trading company.


