Silver Elliott Wave analysis [Video]
![Silver Elliott Wave analysis [Video]](https://editorial.fxstreet.com/images/Markets/Commodities/Metals/Silver/sterling-silver-46984604_XtraLarge.jpg)
Silver Elliott Wave analysis
Function -Trend.
Mode - Trend.
Structure - Impulse for (A).
Position - Wave 3 of (A).
Direction - Wave 4 of (A) .
Details - Currently in wave 4 dip before further rallies for wave 5 of (A) higher. We should see one more leg lower for wave 4.
The current bullish resurgence on Silver started in January 2024 after a sideways move in over a year prior. By projection, it doesn’t look like this bullish run is ending soon. Buyers will continue to wait for dips to buy. With Elliott wave theory, we can identify the identity of the dips and when a bigger pullback is on the way. The current dip that started on 12 April 2024 is expected to take a leg lower before the bullish trend resumes. In today’s commodity blog post, we will look at the position of the current price in the larger framework and what target traders should expect for the current bullish trend.
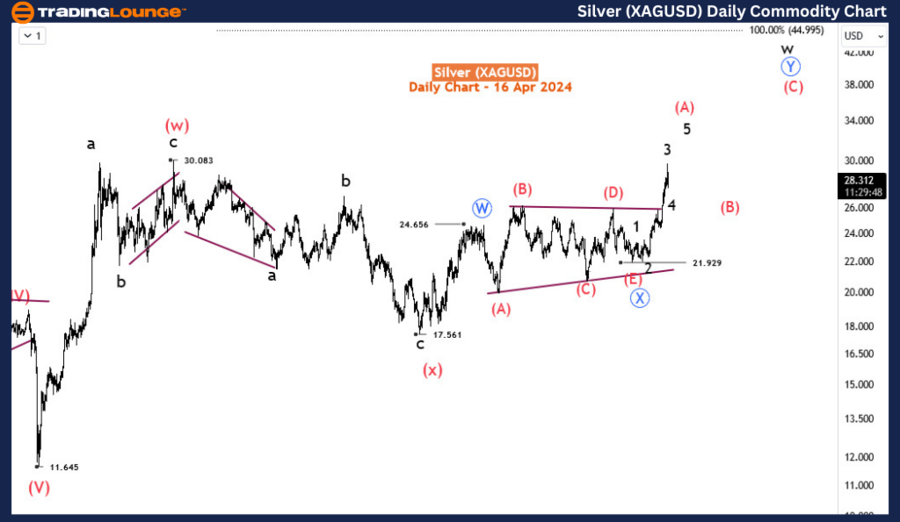
On the daily time frame, we could identify that the current rally is part of a bigger bullish correction that started on March 20, 2022 at 11.645. Since then, a double zigzag pattern has been emerging upwards, labelled waves (w)-(x)-(y) of the supercycle degree. Wave (w) ended at 30.08 on 3rd February 2021 and wave (x) concluded at 17.56 on 31 August 2022. By projection, wave (y) could reach 44.995 if we get a 100% relationship between (w) and (y) which often happens with zigzag structured. From the 2022 low of 17.56, wave (y) is emerging and itself now sub-divides into blue waves ‘W’-’X’-’Y’ - a double zigzag pattern. Blue wave ‘W’ ended on 3rd February 2023 at 24.65 before price entered in to a triangle sideways structure for blue wave ‘X’ that lasted for over a year.
Currently, we are in wave (y) of the supercycle degree that can sub-divide into at least three waves. Current rally is the first leg or first leg of the first sub-wave of (x). If we go with the latter, then we are in wave (A) of w of (x) but if we go with the former, we are in wave a of (w). All these may sound confusing to a beginner in the subject of Elliott wave theory. We can just focus on wave (A) ahich is expected to be an impulse from 21.929. The H4 time frame shows its sub-waves more clearly.
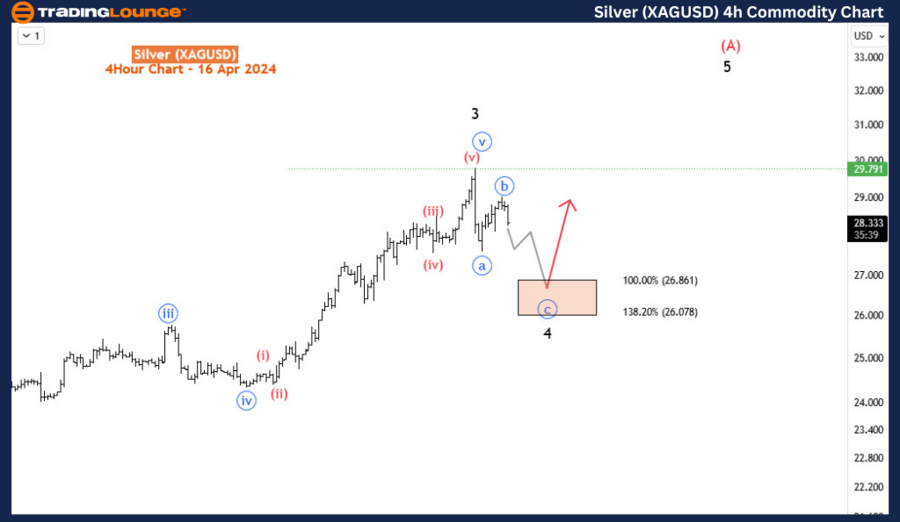
On the H4 time frame, we are currently in wave 4 pullback of wave (A). 1st and 2nd legs of wave 4 seem to have completed. We will expect another leg lower into the 26.86-26.07 Fibonacci extension zone where wave 4 might find a support for further rallies in wave 5 of (A). Therefore, we can conclude that current dip has not violated the bullish development in anyway. It’s just an opportunity for new and existing buyers to get in long positions from the dip.
Silver Elliott Wave analysis [Video]
Author

Peter Mathers
TradingLounge
Peter Mathers started actively trading in 1982. He began his career at Hoei and Shoin, a Japanese futures trading company.


