Shutdown dead ahead?

USD: Mar '25 is Down at 103.700.
Energies: Apr '25 Crude is Up at 67.22.
Financials: The Jun '25 30 Year T-Bond is Lower by 12 ticks and trading at 116.25.
Indices: The Mar '25 S&P 500 emini ES contract is 168 ticks Higher and trading at 5569.50.
Gold: The Apr'25 Gold contract is trading Up at 3008.80.
Initial conclusion
This is not a correlated market. The USD is Down and Crude is Up which is normal, and the 30 Year T-Bond is trading Lower. The Financials should always correlate with the US dollar such that if the dollar is Higher, then the bonds should follow and vice-versa. The S&P is Higher and Crude is trading Higher which is not correlated. Gold is trading Higher which is correlated with the US dollar trading Down. I tend to believe that Gold has an inverse relationship with the US Dollar as when the US Dollar is down, Gold tends to rise in value and vice-versa. Think of it as a seesaw, when one is up the other should be down. I point this out to you to make you aware that when we don't have a correlated market, it means something is wrong. As traders you need to be aware of this and proceed with your eyes wide open. All of Asia traded Lower except the Aussie and Singapore exchanges. All of Europe is trading Higher.
Possible challenges to traders
-
Prelim UoM Consumer Sentiment is out at 10 AM EST. This is Major.
-
Prelim UoM Inflation Expectations is out at 10 AM EST. This is Major.
Traders, please note that we've changed the Bond instrument from the 10 year (ZN) to the 2 year (ZT). They work exactly the same.
We've elected to switch gears a bit and show correlation between the 2-year Treasury notes (ZT) and the S&P futures contract. The YM contract is the Dow Jones Industrial Average, and the purpose is to show reverse correlation between the two instruments. Remember it's likened to a seesaw, when up goes up the other should go down and vice versa.
Yesterday the ZT veered Higher at around 7:30 AM EST as the all-important PPI numbers were released. The Dow moved Lower at the same time. Look at the charts below and you'll see a pattern for both assets. The Dow moved Lower at 7:30 AM EST and the ZT moved Higher at around the same time. These charts represent the newest version of Bar Charts, and I've changed the timeframe to a 15-minute chart to display better. This represented a Long opportunity on the 2-year note, as a trader you could have netted about 20 plus ticks per contract on this trade. Each tick is worth $7.625. Please note: the front month for ZT is now Jun '25 and the Dow is still Mar '25. I've changed the format to filled Candlesticks (not hollow) such that it may be more apparent and visible.
Charts courtesy of barcharts
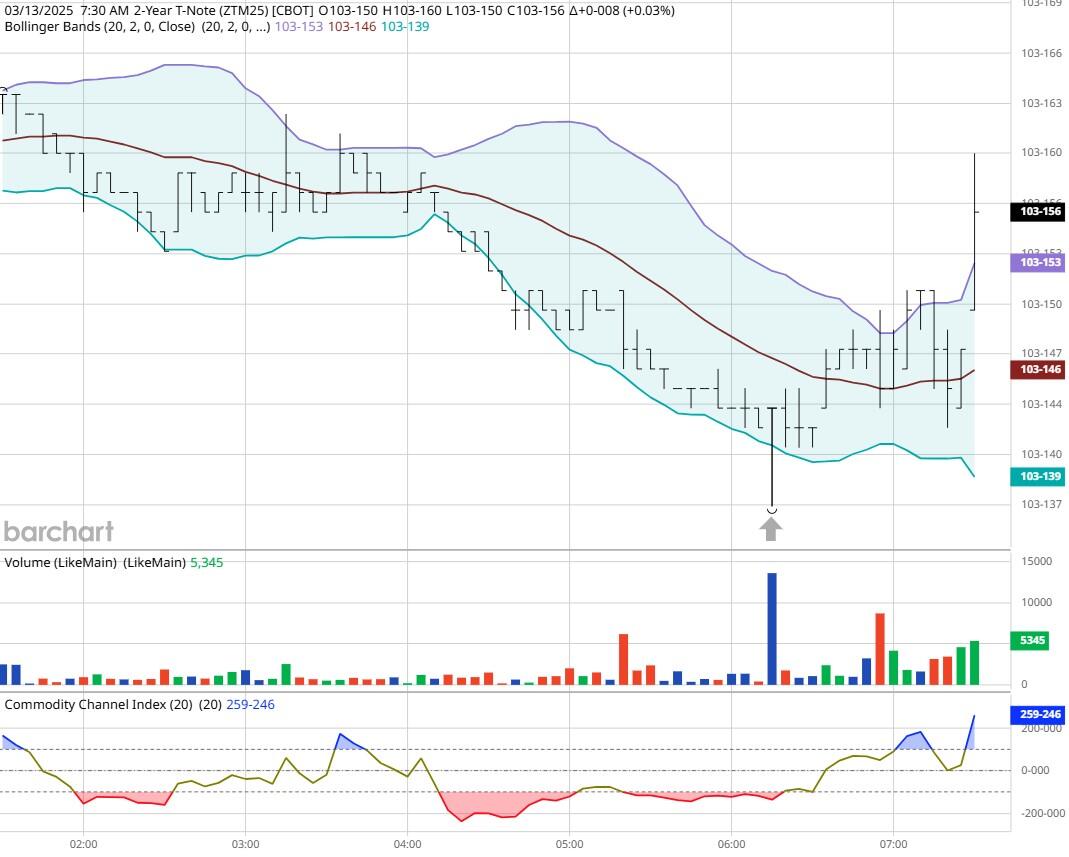
ZT -Jun 2025 - 3/13/25
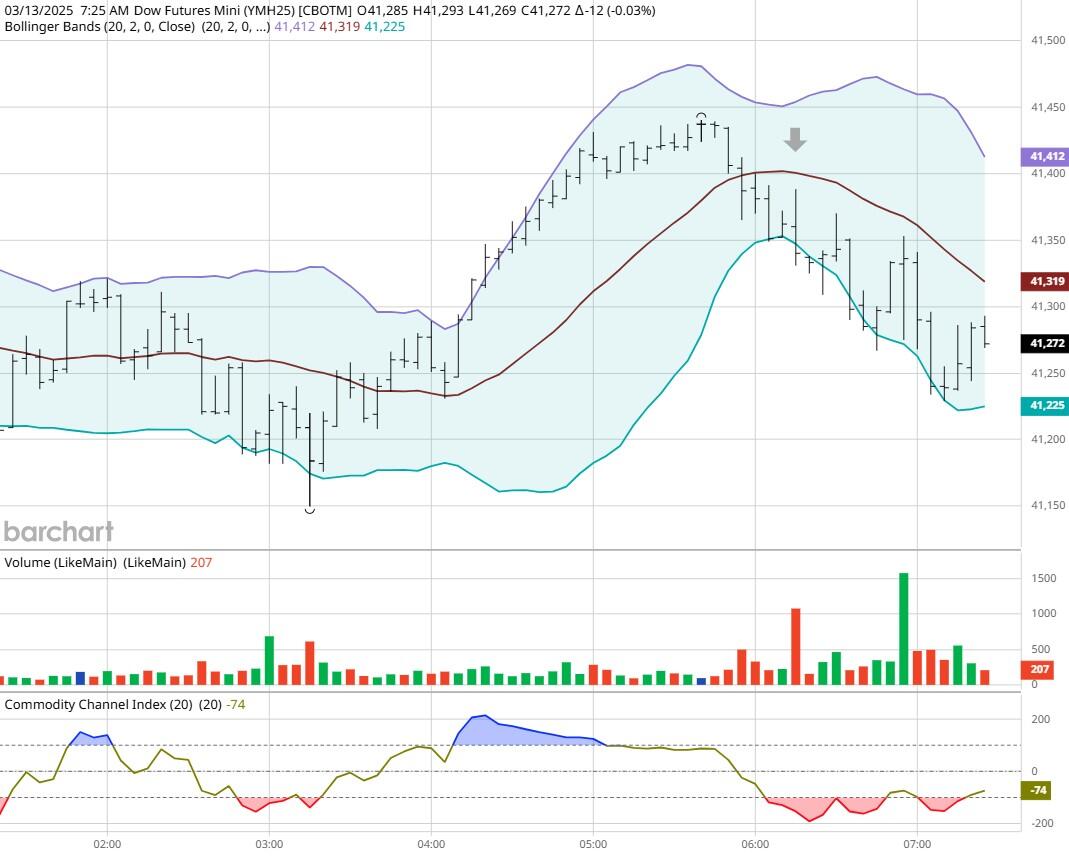
Dow - Mar 2025- 3/13/25
Bias
Yesterday we gave the markets a Downside bias as the Bonds and USD were trading Higher Thursday morning and that is usually indicative of a Downside market. The indices didn't disappoint as the Dow dropped 334 points and the other indices lost ground as well. Today we aren't dealing with a correlated market, and our bias is to the Upside.
Could this change? Of Course. Remember anything can happen in a volatile market.
Commentary
Yesterday we were hit with the news that the Democrats will reject a proposed budget submitted by the Republican controlled House of Representatives as the Dems claim it will cut into many programs that most people depend on such as Medicaid. If the Dems do reject the budget, then I have no doubt that the GOP will blame them for shutting down the government. Gee I seem to recall when the GOP did this during Trump's first term. Is a shutdown imminent? As in all things only time will tell, we should know by the end of business today.
Author

Nick Mastrandrea
Market Tea Leaves


