Shutdown averted, for now

USD: Mar '24 is Down at 103.855.
Energies: Apr '24 Crude is Down at 78.22.
Financials: The June '24 30 Year T-Bond is Down 14 ticks and trading at 118.10.
Indices: The Mar '24 S&P 500 emini ES contract is 52 ticks Lower and trading at 5068.00.
Gold: The Apr'24 Gold contract is trading Down at 2038.70.
Initial conclusion
This is not a correlated market. The USD is Down and Crude is Down which is not normal, and the 30 Year T-Bond is trading Lower. The Financials should always correlate with the US dollar such that if the dollar is Higher, then the bonds should follow and vice-versa. The S&P is Lower and Crude is trading Lower which is not correlated. Gold is trading Lower which is not correlated with the US dollar trading Down. I tend to believe that Gold has an inverse relationship with the US Dollar as when the US Dollar is down, Gold tends to rise in value and vice-versa. Think of it as a seesaw, when one is up the other should be down. I point this out to you to make you aware that when we don't have a correlated market, it means something is wrong. As traders you need to be aware of this and proceed with your eyes wide open. Asia is trading Higher with the exception of the Nikkei and Hang Seng exchanges which are Lower. Currently all of Europe is trading Higher with the exception of the Spanish IBEX and Paris exchanges which are Lower.
Possible challenges to traders
-
Core PCE Price Index m/m out at 8:30 AM EST. This is Major.
-
Unemployment Claims are out at 8:30 AM EST. This is Major.
-
Personal Income m/m is out at 8:30 AM EST. This is Major.
-
Personal Spending is out at 8:30 AM EST. This is Major.
-
Chicago PMI is out at 9:45 AM EST. This is Major.
-
Pending Home Sales m/m is out at 10 AM EST. This is Major.
-
Natural Gas Storage is out at 10:30 AM EST. This is Major.
-
FOMC Member Bostic Speaks at 10:50 AM EST. This is Major.
-
FOMC Member Mester Speaks at 1:15 PM EST. This is Major.
Treasuries
Traders, please note that we've changed the Bond instrument from the 30 year (ZB) to the 10 year (ZN). They work exactly the same.
We've elected to switch gears a bit and show correlation between the 10-year bond (ZN) and the S&P futures contract. The S&P contract is the Standard and Poor's, and the purpose is to show reverse correlation between the two instruments. Remember it's likened to a seesaw, when up goes up the other should go down and vice versa.
Yesterday the ZN migrated Higher at around 11 AM EST as the S&P hit a High at around the same time. If you look at the charts below the S&P gave a signal at around 11 AM and the ZN started its Upward slide. Look at the charts below and you'll see a pattern for both assets. S&P hit a High at around 11 AM and migrated Lower. These charts represent the newest version of MultiCharts and I've changed the timeframe to a 15-minute chart to display better. This represented a Long opportunity on the 10-year note, as a trader you could have netted about 18 ticks per contract on this trade. Each tick is worth $15.625. Please note: the front month for the ZN is now Jun '24. The S&P contract is still Mar' 24. I've changed the format to filled Candlesticks (not hollow) such that it may be more apparent and visible.
Charts courtesy of MultiCharts built on an AMP platform
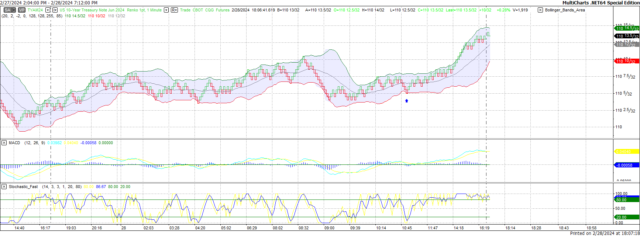
ZN - Mar 2024 - 02/28/24
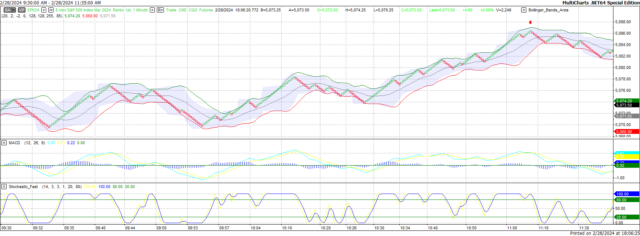
S&P - Mar 2024 - 02/28/24
Bias
Yesterday morning we gave the markets a Downside bias as both the USD and the Bonds were trading Higher Wednesday morning, and this usually represents a Down day. The markets didn't disappoint as the Dow traded 23 points Lower and the other indices lost ground as well. Today we aren't dealing with a correlated market and our bias is Neutral,
Could this change? Of Course. Remember anything can happen in a volatile market.
Commentary
Yesterday we gave the markets a Downside bias as both the USD and the Bonds were trading Higher Wednesday morning and that usually reflects a Downside Day. The markets didn't disappoint us as all the indices traded Lower yesterday. Today we have a bit more news, but I think everyone is waiting to see what the folks in DC will do relative to a budget and avoiding a government shutdown. It seems that this is the first year where no real budget for the fiscal year was ever finalizes. All we've been doing is extending capital so as not to shut down and it seems that this is the way this year for the folks in DC. Will we get a finalizes budget such that this doesn't become an issue again later this year? As in all things, only time will tell. It was reported yesterday evening that a stop gap measure was put into place that would fund the government until Friday, March 8th or the 22nd. This is not a full year budget, only a temporary fix.
Author

Nick Mastrandrea
Market Tea Leaves


