September could be the biggest month of the year

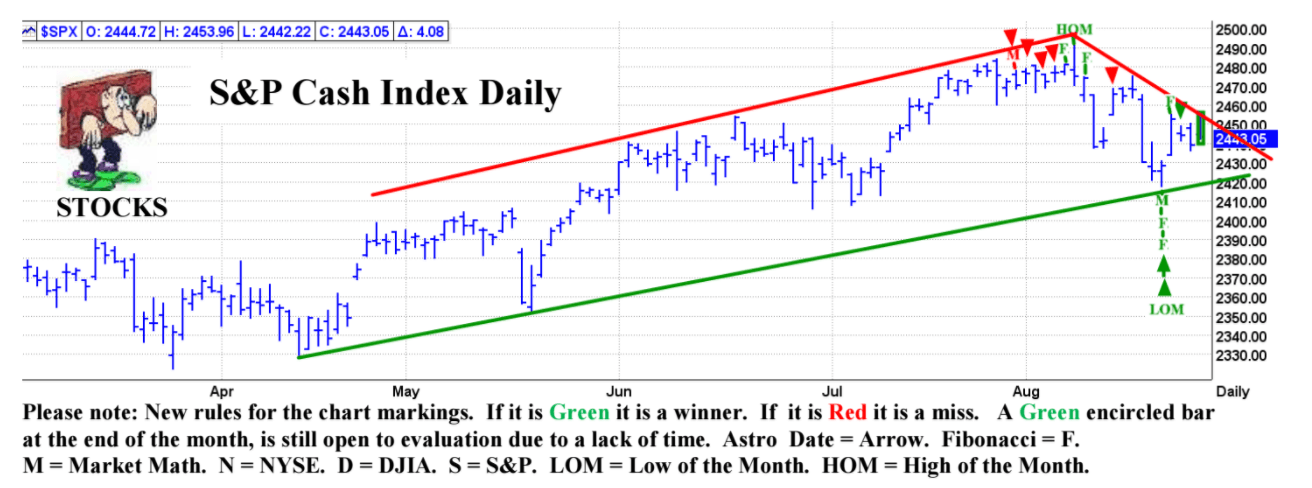
Technically, the S&P has been following a multi month up channel. However, it made asignificant high on 8/8, just past the 8/7 Lunar Eclipse. The market then declined to the low of the month on 8/21, the day of the Solar Eclipse. It would be fair to say that the eclipses were a major factor for the Stock Market in August.
Looking ahead, our Planetary Index models indicate that this month could be the biggest month of the year and possibly the biggest month of the past few years. When adding up the points for this model, I got a total of 3900 points, which is more than twice the average. These are potentially DJIA points. However, the hardest thing to do in making these forecasts is amplitude. If I can get the timing and direction, and get within 50% of the amplitude, that would be a great success. Given that factor, in actuality, there is a potential for the DJIA to have a move in September of about 2000 points or about 10%. Of course, the next question is which way?
One of our indicators that has been working well is the DJIA Inverted Fractal Model which nailed the 8/8 high almost to the day. This forecast was published in February. This is a long term forecast so the resolution is not usually so precise as to the exact day. However, this model was also confirmed by our 2017 Super Bowl Fractal, which forecast that around 8/7 there should be the biggest turning point of the year.
Our Planetary Index Models are dependent on whether the market adheres to our Planetary Inversion Theory. This theory says that the planetary energy is likeky to invert within one trading day of a Planetary Polarity Point. These are either Planetary Station Points or when a Planet reaches 0 degrees of Latitude. The traditional Bradley model does not take these factors into account. If the market ignores these points and follows the traditional rules, then the market is likely headed just about straight down. On the other hand, we have seen many months when the market followed the inverted model, that would mean the market is headed just about straight up. I don’t think either of these models are the most likely. Let’s take a moment to check out the four Planetary Polarity Points that will occur in the coming month.
8/29 – Venus 0 North Latitude.
9/01 AC – Mercury in Leo turns Direct.
9/08 AC – Mercury 0 North Latitude. 9/28 AM – Pluto in Capricorn turns Direct.
These are our top Planetary change in trend points and they are likely to have a major influence over the path for the Stock Market this month.
Technically, I think it is likely we saw a major high on 8/8. If this is correct, we will look for confirmation via the S&P breaking the 8/21 low at the 2418 level. If this occurs, then the most likely path is down. However the early part of the month is likely to be in a narrow choppy range. The big trend, whether up or down, is likely to occur beginning about 9/11. Keep in mind that the following scenario could be inverted. Having said that, I see a small rally into 8/30, then a decline into the 9/1 Labor Day weekend. Then there should be a rally into the 9/8 weekend with 9/11 possibly being the big change in trend window. If the market has rallied into that weekend, then the market could be at a significant high.
This is an excerpt from the Astro Trend newsletter. Astro-Trend covers about thirty futures related markets including the major Financial Markets, such as the Stock Market, T-Bonds, Currencies, and most major commodities. We also offer intra day data which identifies potential change in trend points to the minute.
Author

Norm Winski
Independent Analyst
www.astro-trend.com


