Sell in May and go away? [Video]
![Sell in May and go away? [Video]](https://editorial.fxstreet.com/images/Markets/Bonds/Bond/united-states-savings-bonds-with-american-currency-financial-security-34744494_XtraLarge.jpg)
US Dollar: Jun '22 USD is Down at 103.555.
Energies: Jun '22 Crude is Down at 104.62.
Financials: The Jun '22 30 Year bond is Up 30 ticks and trading at 141.01.
Indices: The Jun '22 S&P 500 Emini ES contract is 240 ticks Lower and trading at 3863.00.
Gold: The Jun'22 Gold contract is trading Up at 1827.00. Gold is 111 ticks Higher than its close.
Initial conclusion
This is not a correlated market. The dollar is Down and Crude is Down which is not normal, and the 30-year Bond is trading Higher. The Financials should always correlate with the US dollar such that if the dollar is lower, then the bonds should follow and vice-versa. The S&P is Lower, and Crude is trading Lower which is not correlated. Gold is trading Higher which is correlated with the US dollar trading Down. I tend to believe that Gold has an inverse relationship with the US Dollar as when the US Dollar is down, Gold tends to rise in value and vice-versa. Think of it as a seesaw, when one is up the other should be down. I point this out to you to make you aware that when we don't have a correlated market, it means something is wrong. As traders you need to be aware of this and proceed with your eyes wide open. Asia is trading Lower with the exception of the Shanghai exchange which is Higher at this time. Currently all of Europe is trading Lower. .
Possible challenges to traders today
-
Philly Fed Mfg Index is out at 8:30 AM EST. This is Major.
-
Unemployment Claims are out at 8:30 AM EST. This is Major.
-
Existing Home Sales are out at 10 AM EST. This is Major.
-
CB Leading Index is out at 10 AM EST. This is Major.
-
Natural Gas Storage is out at 10:30 AM EST. This is Major.
Treasuries
Traders, please note that we've changed the Bond instrument from the 30 year (ZB) to the 10 year (ZN). They work exactly the same.
We've elected to switch gears a bit and show correlation between the 10-year bond (ZN) and the S&P futures contract. The S&P contract is the Standard and Poor's, and the purpose is to show reverse correlation between the two instruments. Remember it's likened to a seesaw, when up goes up the other should go down and vice versa.
Yesterday the ZN made its move at around 1 PM EST. The ZN hit a Low at around that time and the S&P moved Lower shortly thereafter. If you look at the charts below ZN gave a signal at around 1 PM EST and the S&P moved Lower at around the same time. Look at the charts below and you'll see a pattern for both assets. ZN hit a Low at around 1 PM EST and the S&P was moving Lower shortly thereafter. These charts represent the newest version of MultiCharts and I've changed the timeframe to a 15-minute chart to display better. This represented a Long opportunity on the 10-year note, as a trader you could have netted about 20 ticks per contract on this trade. Each tick is worth $15.625. Please note: the front month for the ZN is now Jun '22. The S&P contract is also Jun' 22 as well. I've changed the format to Heikin-Ashi such that it may be more apparent and visible.
Charts courtesy of MultiCharts built on an AMP platform
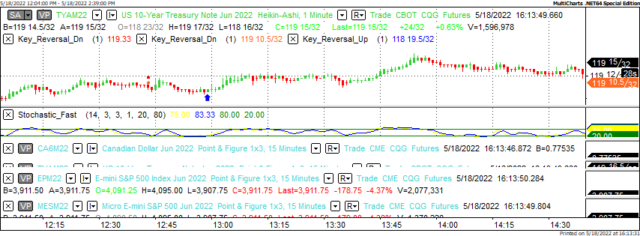
ZN - Jun 2022 - 05/18/22
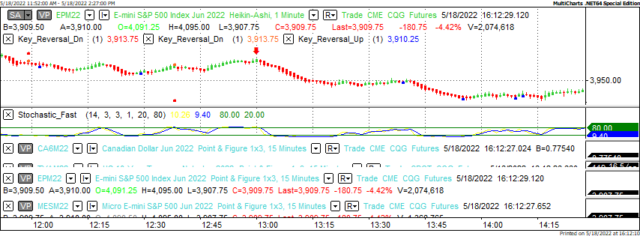
S&P - Jun 2022 - 05/18/22
Bias
Yesterday we gave the markets a Downside bias as both the USD and the Bonds were trading Higher Wednesday morning, and this usually reflects a Downside Day. The markets did disappoint as the Dow dropped 1,165 points (and no that's no typo) and the other indices lost ground as well. Today we aren't dealing with a correlated market and our bias is Neutral.
Could this change? Of Course. Remember anything can happen in a volatile market.
Commentary
Yesterday we expected the markets to have a Down Day but we didn't expect a drop of over one thousand points on the Dow alone. The only thing we can think of is everyone is using the "R" these days. R meaning recession as stocks prices are dropping and teh huge concern today is inflation. Inflation is very real in the United States as many companies lost money during the pandemic and are eager to ratchet gains. But we should be clear. The shutdown during teh pandemic was self inflicted brought about by a health crisis. A true recession happens for purely economic reasons. Other than higher prices I'm not seeing much evidence for an economic slowdown. Could it be general malaise over conditions in general: war in Ukraine, Higher Prices and the fact that the US just lost over one million people to Covid 19? Or could it be that some traders are following and age old adage: Sell in May and go away? This used to be very real up to a few years ago. Could that be happening again? As in all things, only time will tell....
Author

Nick Mastrandrea
Market Tea Leaves


