|

Seabridge Gold Analysis: Stock Should Remain Supported

In today's blog, we will have a look at the Seabridge Gold stock. The stock is listed in the SP 500.

Seabridge Gold is a Canadian resource gold mining company headquartered in Toronto Ontario Canada. It was founded in 1979 as Copper Mines Ltd. Over the last years, the stock lost 91% of its value. Starting from November 2007 peak. The stock dropped to $3.45 low which marked in July 2015. From its 2007 peak ti reaches the equal legs towards 4.70 area and from there a bigger reaction higher in favor of the stock was expected to take place. It was a perfect equal leg hit. Above from 3.45, it managed to gain over 342% from (3.45 to around 16.79).

Let's have a look at the weekly price action and what to expect for the company.

Seabridge Gold 09.29.2019 Weekly Chart

Gold

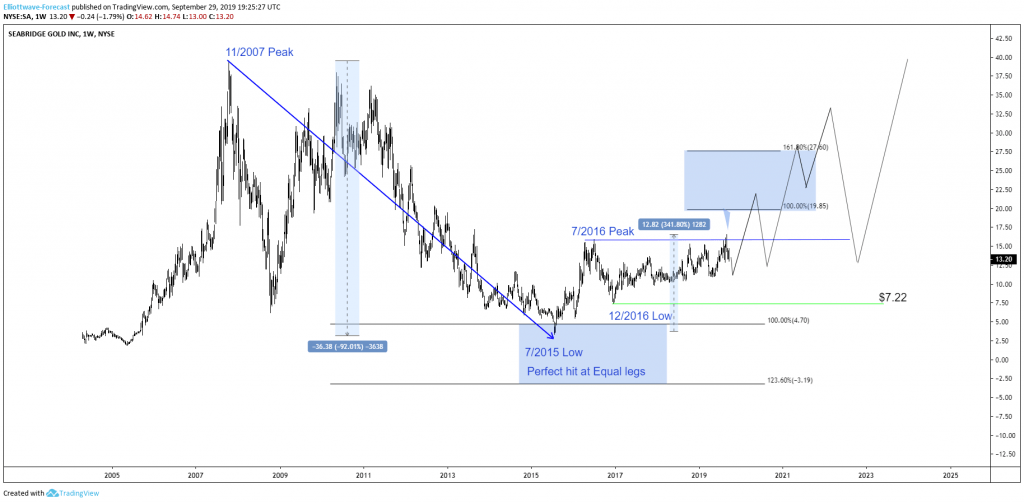
In the chart above you can see that the stock ended the cycle from 2007 peak at 2015 low. Above from there, Seabridge Gold has been showing strength. Below 2007 peak, it has been in the progress of correcting that in 3-7 or 11 swings. Recently, Seabridge Gold broke above 7/2016 peak opening up a higher high sequence. With that said, the stock has an incomplete sequence from 2015 low indicating that more upside towards 19.85-27.60.

Summarizing, the stock should see more upside in the next weeks into 19.85-27.60. Anyway, as you can see there should be strong in the next years. Of course, nothing runs in a straight line. There will be pullbacks, but those should be supported in the sequences of 3-7 or 11 swings.

Author

Elliott Wave Forecast Team

Elliott Wave Forecast Team

ElliottWave-Forecast.com

More from Elliott Wave Forecast Team
Share:

Editor's Picks

EUR/USD hits two-day highs near 1.1820

EUR/USD picks up pace and reaches two-day tops around 1.1820 at the end of the week. The pair’s move higher comes on the back of renewed weakness in the US Dollar amid growing talk that the Fed could deliver an interest rate cut as early as March. On the docket, the flash US Consumer Sentiment improves to 57.3 in February.

GBP/USD reclaims 1.3600 and above

GBP/USD reverses two straight days of losses, surpassing the key 1.3600 yardstick on Friday. Cable’s rebound comes as the Greenback slips away from two-week highs in response to some profit-taking mood and speculation of Fed rate cuts. In addition, hawkish comments from the BoE’s Pill are also collaborating with the quid’s improvement.

Gold climbs further, focus is back to 45,000

Gold regains upside traction and surpasses the $4,900 mark per troy ounce at the end of the week, shifting its attention to the critical $5,000 region. The move reflects a shift in risk sentiment, driving flows back towards traditional safe haven assets and supporting the yellow metal.

Crypto Today: Bitcoin, Ethereum, XRP rebound amid risk-off, $2.6 billion liquidation wave

Bitcoin edges up above $65,000 at the time of writing on Friday, as dust from the recent macro-triggered sell-off settles. The leading altcoin, Ethereum, hovers above $1,900, but resistance at $2,000 caps the upside. Meanwhile, Ripple has recorded the largest intraday jump among the three assets, up over 10% to $1.35.

Three scenarios for Japanese Yen ahead of snap election

The latest polls point to a dominant win for the ruling bloc at the upcoming Japanese snap election. The larger Sanae Takaichi’s mandate, the more investors fear faster implementation of tax cuts and spending plans. 

XRP rally extends as modest ETF inflows support recovery

Ripple is accelerating its recovery, trading above $1.36 at the time of writing on Friday, as investors adjust their positions following a turbulent week in the broader crypto market. The remittance token is up over 21% from its intraday low of $1.12.