Scotus propels markets?

USD: Sept '24 is Up at 105.675.
Energies: Aug '24 Crude is Up at 84.15.
Financials: The Sept '24 30 Year T-Bond is Up 12 ticks and trading at 116.15
Indices: The Sept '24 S&P 500 emini ES contract is 34 ticks Lower and trading at 5530.00.
Gold: The Aug'24 Gold contract is trading Down at 2333.60
Initial conclusion
This is not a correlated market. The USD is Up and Crude is Up which is not normal, and the 30 Year T-Bond is trading Up. The Financials should always correlate with the US dollar such that if the dollar is Higher, then the bonds should follow and vice-versa. The S&P is Lower and Crude is trading Higher which is correlated. Gold is trading Lower which is correlated with the US dollar trading Up. I tend to believe that Gold has an inverse relationship with the US Dollar as when the US Dollar is down, Gold tends to rise in value and vice-versa. Think of it as a seesaw, when one is up the other should be down. I point this out to you to make you aware that when we don't have a correlated market, it means something is wrong. As traders you need to be aware of this and proceed with your eyes wide open. All of Asia traded Higher in the overnight session. Currently all of Europe is trading Lower.
Possible challenges to traders
-
Fed Chair Powell Speaks at 9:30 AM EST. This is Major.
-
JOLTS Job Openings is out at 10 AM EST. This is Major.
-
RCM/TIPP Economic Optimism - tentative. This is Major.
-
Wards Total Vehicle Sales - All Day by Brand. This is Major.
Traders, please note that we've changed the Bond instrument from the 10 year (ZN) to the 2 year (ZT). They work exactly the same.
We've elected to switch gears a bit and show correlation between the 10-year Treasury notes (ZN) and the S&P futures contract. The YM contract is the Dow Jones Industrial Average, and the purpose is to show reverse correlation between the two instruments. Remember it's likened to a seesaw, when up goes up the other should go down and vice versa.
Yesterday the ZT migrated Higher at around 8:45 AM EST. If you look at the charts below the ZT gave a signal at around 8:45 AM and started its Upward climb. Look at the charts below and you'll see a pattern for both assets. The Dow moved Lower at around 8:45 AM and the ZT moved Higher at around the same time. These charts represent the newest version of BarCharts and I've changed the timeframe to a 15-minute chart to display better. This represented a Long opportunity on the 2-year note, as a trader you could have netted about 20 plus ticks per contract on this trade. Each tick is worth $7.625. Please note: the front month for ZT is Sept and the Dow is now Sept '24. I've changed the format to filled Candlesticks (not hollow) such that it may be more apparent and visible.
Charts courtesy of barcharts
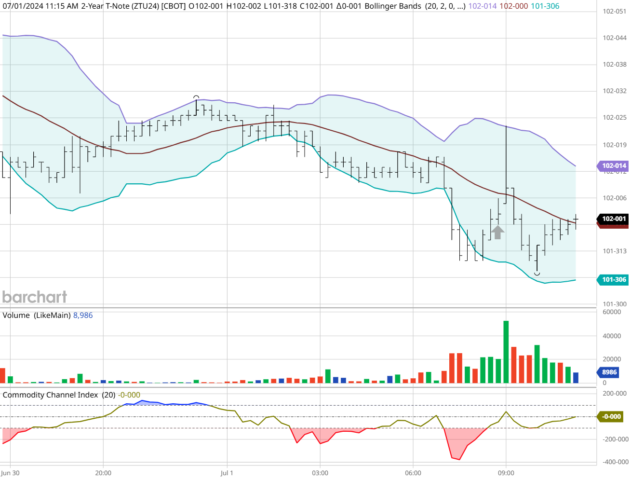
ZT -Sept 2024 - 07/01/24
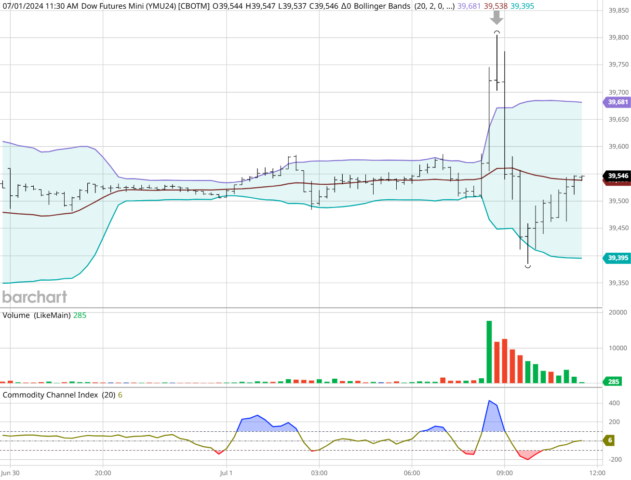
Dow - Sept 2024 - 07/01/24
Bias
Yesterday we gave the markets an Upside bias as we saw evidence of Market Correlation Monday morning. The markets didn't disappoint as the indices rose yesterday. Not by much for sure but a win is still a win. Today we aren't dealing with a correlated market and our bias is to the Downside.
Could this change? Of Course. Remember anything can happen in a volatile market.
Commentary
Yesterday at around 10 AM EST the Supreme Court made a decision regarding Presidential immunity. They claim that the President isn't immune to the law but with any official acts he is. This is at best confusing and will probably require a team of judges and lawyers to make that determination. In any case it appears as though their decision did help the markets yesterday. Today we have Jolts Job Openings, Total Vehicle Sales and the Fed Chair Powell will be speaking. Perhaps we may see an upswing on yesterday's market? As in all things, only time will tell...
Author

Nick Mastrandrea
Market Tea Leaves


