Russia ruins possible rally [Video]
![Russia ruins possible rally [Video]](https://editorial.fxstreet.com/images/Macroeconomics/Countries/Asia/RussianFederation/st-basil-cathedral-10155573_XtraLarge.jpg)
US Dollar: Mar '22 USD is Up at 96.330.
Energies: Mar '22 Crude is Up at 93.13.
Financials: The Mar '22 30 Year bond is Up 10 ticks and trading at 152.31.
Indices: The Mar '22 S&P 500 emini ES contract is 156 ticks Lower and trading at 4370.50.
Gold: The Apr'22 Gold contract is trading Up at 1855.20. Gold is 137 ticks Higher than its close.
Initial conclusion
This is not a correlated market. The dollar is Up, and Crude is Up which is not normal, and the 30-year Bond is trading Higher. The Financials should always correlate with the US dollar such that if the dollar is lower, then the bonds should follow and vice-versa. The S&P is Lower, and Crude is trading Higher which is correlated. Gold is trading Higher which is not correlated with the US dollar trading Up. I tend to believe that Gold has an inverse relationship with the US Dollar as when the US Dollar is down, Gold tends to rise in value and vice-versa. Think of it as a seesaw, when one is up the other should be down. I point this out to you to make you aware that when we don't have a correlated market, it means something is wrong. As traders you need to be aware of this and proceed with your eyes wide open. Currently all of Asia is trading Lower. All of Europe is trading Lower as well.
Possible challenges to traders today
-
Mortgage Delinquencies - tentative. This is Major.
-
FOMC Member Bullard Speaks at 11 AM EST. This is Major.
Treasuries
Traders, please note that we've changed the Bond instrument from the 30 year (ZB) to the 10 year (ZN). They work exactly the same.
We've elected to switch gears a bit and show correlation between the 10-year bond (ZN) and the S&P futures contract. The S&P contract is the Standard and Poor's, and the purpose is to show reverse correlation between the two instruments. Remember it's likened to a seesaw, when up goes up the other should go down and vice versa.
On Friday the ZN made its move at around 11:30 AM EST. The ZN hit a Low around that time and the S&P moved Lower. If you look at the charts below ZN gave a signal at around 11:30 AM EST and the S&P moved Lower at around the same time. Look at the charts below and you'll see a pattern for both assets. ZN hit a Low at around 11:30 AM EST and the S&P was moving Lower shortly thereafter. These charts represent the newest version of MultiCharts and I've changed the timeframe to a 30-minute chart to display better. This represented a Long opportunity on the 10-year note, as a trader you could have netted about 50 plus ticks per contract on this trade. Each tick is worth $15.625. Please note: the front month for the ZN is now Mar '22. The S&P contract is now Mar '22 as well. I've changed the format to Renko bars such that it may be more apparent and visible.
Charts courtesy of MultiCharts built on an AMP platform
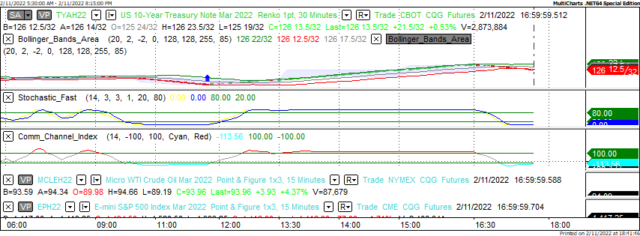
ZN - Mar 2022 - 02/11/22
-637804373577455420.png)
S&P - Mar 2022 - 02/11/22
Bias
On Friday we gave the markets a Downside bias as both the USD and the Bonds were trading Higher, and this usually reflects a Downside Day. The Markets didn't disappoint as the Dow dropped 504 points and the other indices lost ground as well. Today we aren't dealing with a correlated market and our bias is to the Downside.
Could this change? Of Course. Remember anything can happen in a volatile market.
Commentary
When we looked at the markets early Friday AM as is our custom, we felt a continuation of Thursday's slide. However early in the trading session it appeared as though the markets wanted to migrate Higher, after 10 AM that changed. The markets dived Lower and remained in negative territory for the remainder of the session. News came out that suggested a Russian invasion of the Ukraine was imminent and may in fact happen prior to the conclusion of the Winter Olympics currently being held in China. The impact of such an event cannot be underestimated. Russia supplies most of Europe with well needed natural gas used for cooking and heating homes. Natural Gas is already trading Higher due to the Winter season, this invasion will drive it Higher even further. The political aspect of this shouldn't be overlooked either. Putin claims that he doesn't want a NATO nation right next door to Russia but if he overtakes the Ukraine, what is right next door? Poland, a NATO nation. So, the question is when will enough be enough? Only time will tell.
Author

Nick Mastrandrea
Market Tea Leaves


