RUSSELL 2000 Technical Analysis: Long-Term Structure Calls for a Flat Pattern in Progress

The stock market participants show increasing its pessimistic sentiment aided by the growing developments on the coronavirus epidemic, which is fueling the fears of a global economic slowdown. However, the Elliott wave perspective seems to be anticipating an escalating "bad news."
Looking at the Russell 200 log-scale weekly chart from an Elliott wave perspective, we observe the bullish cycle that began in early March 2009 when Russell found fresh buyers at 341.76 pts.

Russell 2000 completed a five-wave sequence of Intermediate degree in early September 2018, once the U.S. index reached at 1,745.3 pts.
According to the channeling method described by the R. N. Elliott, the projection of the ascending trendline between the end of waves (2) and (4), on the high of wave (3) creates a channel whose upper border provides the potential end of the fifth wave.
We see on the chart that the fifth wave of Intermediate degree labeled in blue didn't surpass the upper-line of the channel. However, the decline developed by the low-cap index, dropping below the previous swing low located at 1,409.91 pts., gives us one clue that this rally that started in 2009 has probably
come to an end. We can observe that this decline, which is identified as wave (A) of Intermediate degree, evolved in three internal waves.
The next move, corresponding to wave (B) illustrated in the following chart, looks like a three-wave sequence, which could have ended on January 17th, when Russell topped at 1,713.61 pts.
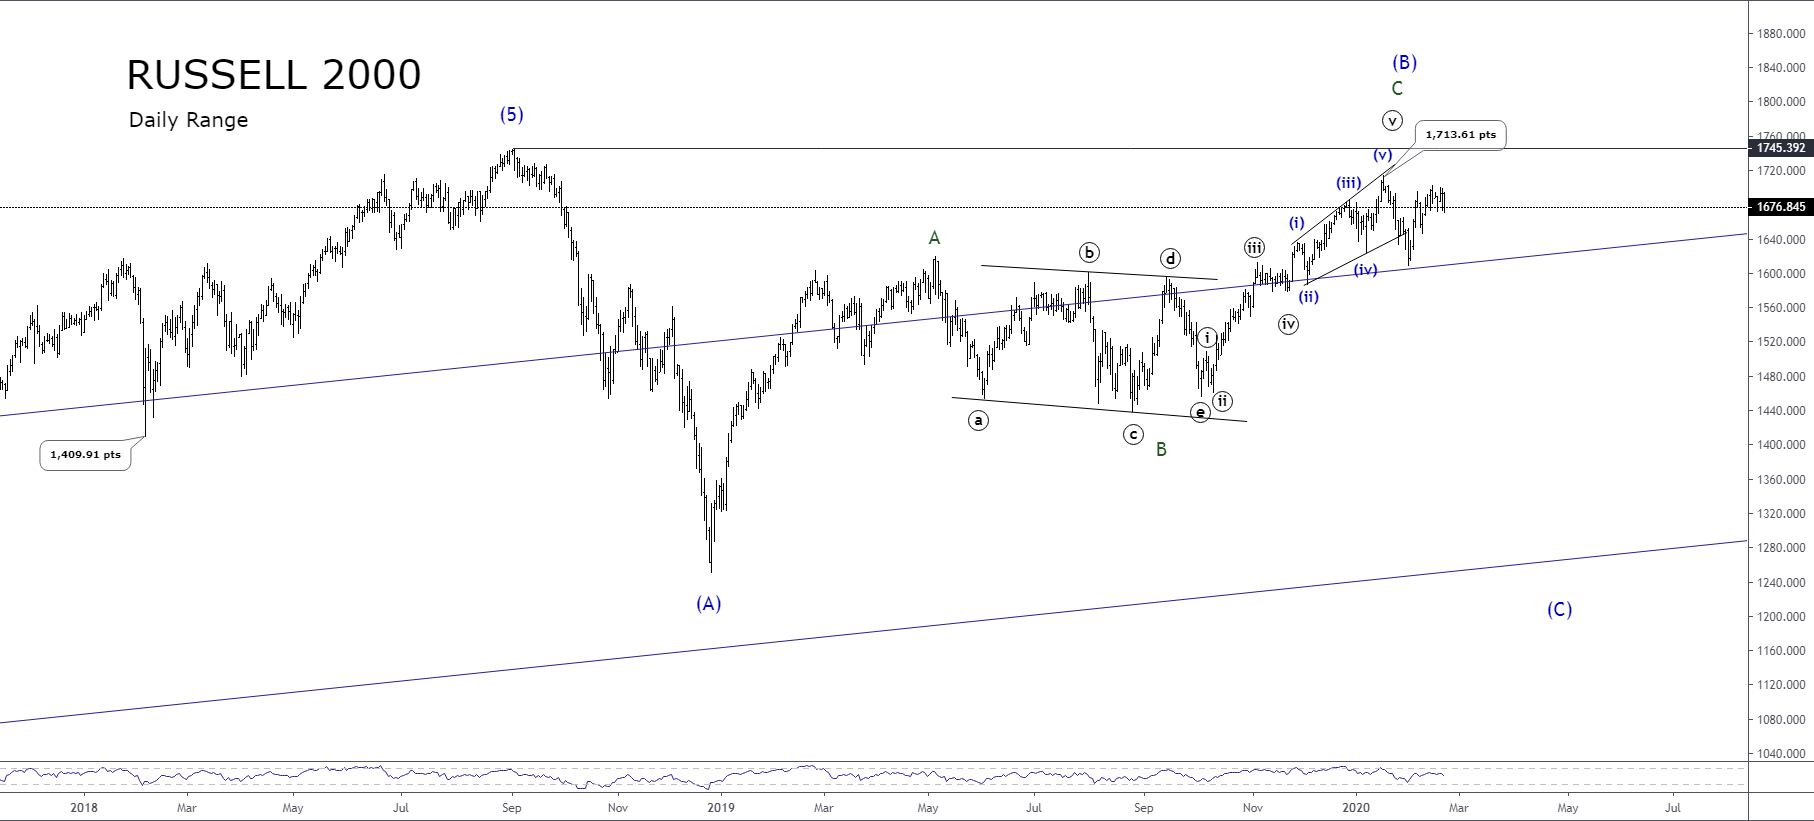
On the second chart, we distinguish that wave (B) of intermediate degree corresponds to a zigzag pattern. This sequence subdivided in 5-3-5, began with the 2018 Santa Claus rally when the index found buyers at 1,250.90 pts.
The wave B of Minor degree labeled in green resembling a triangle pattern was finished in early October 2019, when Russell began its last rally that ended on January 17t, at 1,713.61 pts.
In the same chart, we can observe the ascending five-wave sequence, which developed its fifth wave of Minute degree labeled in black moving in an expanding ending diagonal pattern.
According to the Elliott wave theory, an ending diagonal pattern is an impulsive formation having a 3-3-3-3-3 sequence, and it is commonly found in wave 5 or c.
Summarizing, since the corrective formation holds a first move developed in three waves, and the second ascending movement follows a three-wave sequence, the structure in progress could correspond to a flat pattern. The next step should develop in five waves.
In consequence, according to the potential flat pattern in progress, and considering that the next move should be a bearish wave C of Minor degree, our preferred bias is in the short side.
Author

EagleFX Team
EagleFX
EagleFX Team is an international group of market analysts with skills in fundamental and technical analysis, applying several methods to assess the state and likelihood of price movements on Forex, Commodities, Indices, Metals and


