Return of the king Dollar?

With the tariff announcement behind us and the market focused on navigating this new environment, we are witnessing stability across various markets. In times of volatility, flexibility is crucial, which sometimes necessitates taking a step back until rational market action resumes. Following the -18% intraday drawdown on the S&P 500 and currently sitting at -14% from its all-time highs, significant damage has been inflicted on investor confidence. Irrational behavior can sometimes lead to market opportunities, creating the current dynamic situation.
One critical asset directly impacted by tariffs is the US Dollar. As tariffs increase, cross-border trade decreases, resulting in reduced demand for foreign currencies. In theory, this could provide additional support to the Dollar. However, despite reaching a one-year high and riding the “American Exceptionalism” post-election wave, King Dollar has swiftly fallen off its throne. Since the middle of January, the DXY has fallen approximately 10%, currently hovering at 99.23, just below its two-year support line. One theory suggests that foreign selling of US assets is occurring due to diminished confidence in the potential earnings of US companies. Consequently, the demand for dollars is decreasing as foreigners repatriate their assets back to their home markets. Now that there is a 90-day tariff pause, and the markets are beginning to comprehend our new trading and 10% across-the-board tariff environment, is it time for a rebound in the USD?
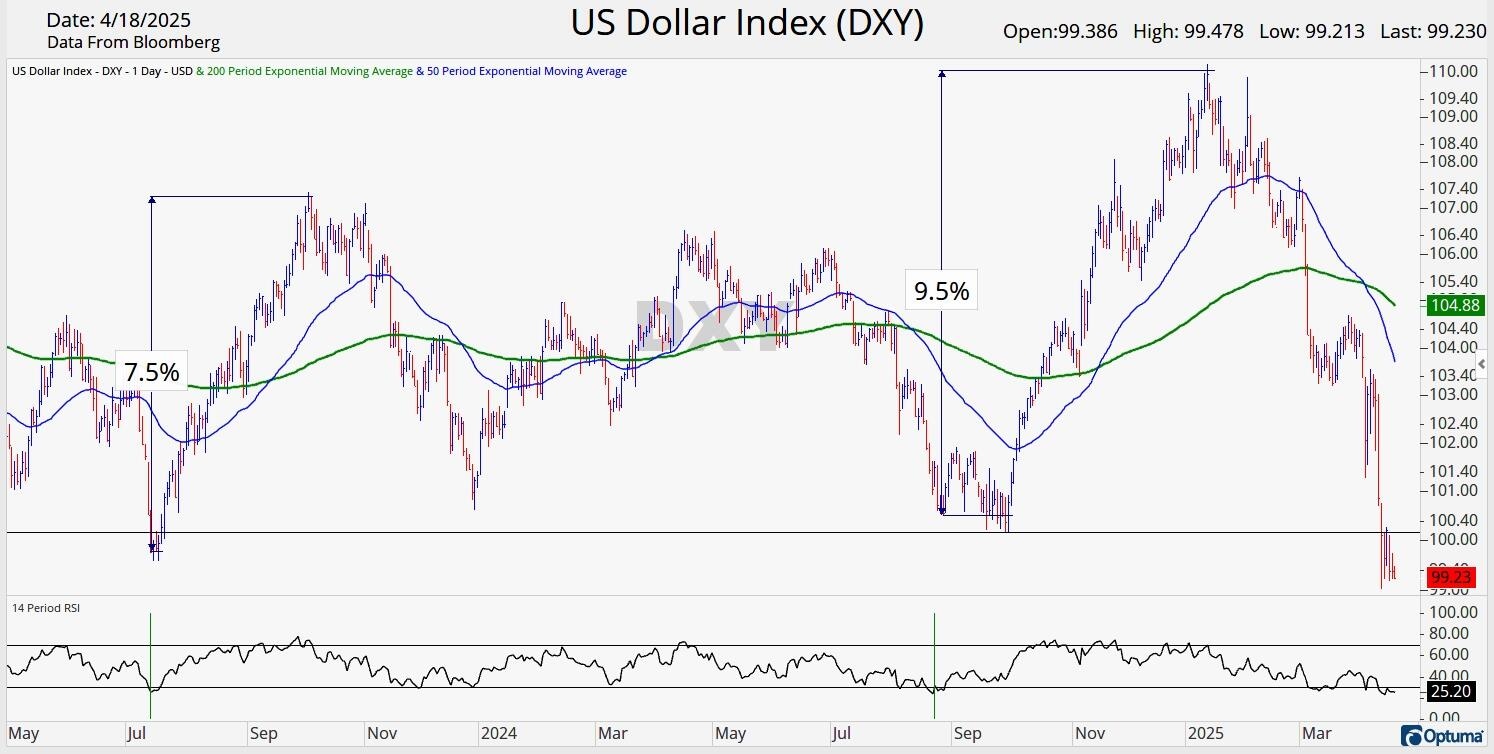
While there are certainly indications that this current decline in the Dollar is excessive, a long Dollar trade today is not for the faint of heart. The short-term setup for the DXY suggests a potential rebound, as the 14-period RSI is currently below 26, indicating oversold conditions. The last two times the RSI on the DXY reached this level, it was followed by two significant bounces, recovering 7.5% and 9.5%, respectively. However, there are some concerning factors to consider. The DXY is currently slightly below its 2-year low and a key support level, possibly forming a Descending Triangle. Descending Triangle patterns are often continuation patterns that emerge during periods of consolidation, indicating that market participants are reducing demand for an asset. A breakout to the downside and a continuation of the downward trend in the DXY would be a powerful signal. Traders considering going long the Dollar in anticipation of a bounce should employ very tight stops to mitigate any potential losses. Any further downside movement could be swift and possibly substantial.
Get paid while outperforming?
Although recent tariff announcements have dampened investor sentiment, not all companies are equally affected. Some sectors of the market have minimal exposure to tariffs since they have little direct impact on a company’s earnings. While recession fears fueled the relative outperformance of the Staples and Healthcare Sectors compared to the S&P 500 year-to-date, both sectors may face high tariff exposure that could affect their bottom lines. Fortunately, there’s one sector almost immune to this, providing a safe haven for investors to earn while they wait. This sector is the Utility Sector, which has seen a year-to-date total return of 3.5%. Comprised of 31 companies and accounting for only 2.6% of the S&P 500’s total weight, the sector’s current yield of around 3% offers a steady investment option during uncertain market conditions.

Now, let’s delve into what I believe is the most valuable chart for investors to analyze. Relative Strength Comparison charts, also known as Relative Index Comparison or (RIC) charts, provide a crucial tool to assess the relative strength of one security compared to another or a benchmark. As investors, we must decide between passive investing and active investing. RIC charts reveal whether your active investment is outperforming or underperforming your benchmark. In other words, if your investment is not outperforming the benchmark, it may be more prudent to own the benchmark and adopt a passive investment strategy.
Using RIC charts, we can clearly observe that the S&P 500 Utility Sector is outperforming the S&P 500 and even accelerating against it. These breakouts are significant indicators of market leadership and often persist until market conditions change. Currently, the RIC chart shows that Utilities are outperforming the S&P 500 and may continue its leadership into the future.
Looks Nifty
While US markets have been tripped by tariffs, international markets have excelled in the face of uncertainty. Asian and European markets almost across the board outperformed the US year-to-date, and some international indices look well…. Nifty. India’s Nifty 50 is one such index that looks to be set up for a bearish to bullish reversal and is showing signs of strength despite tariff uncertainty.
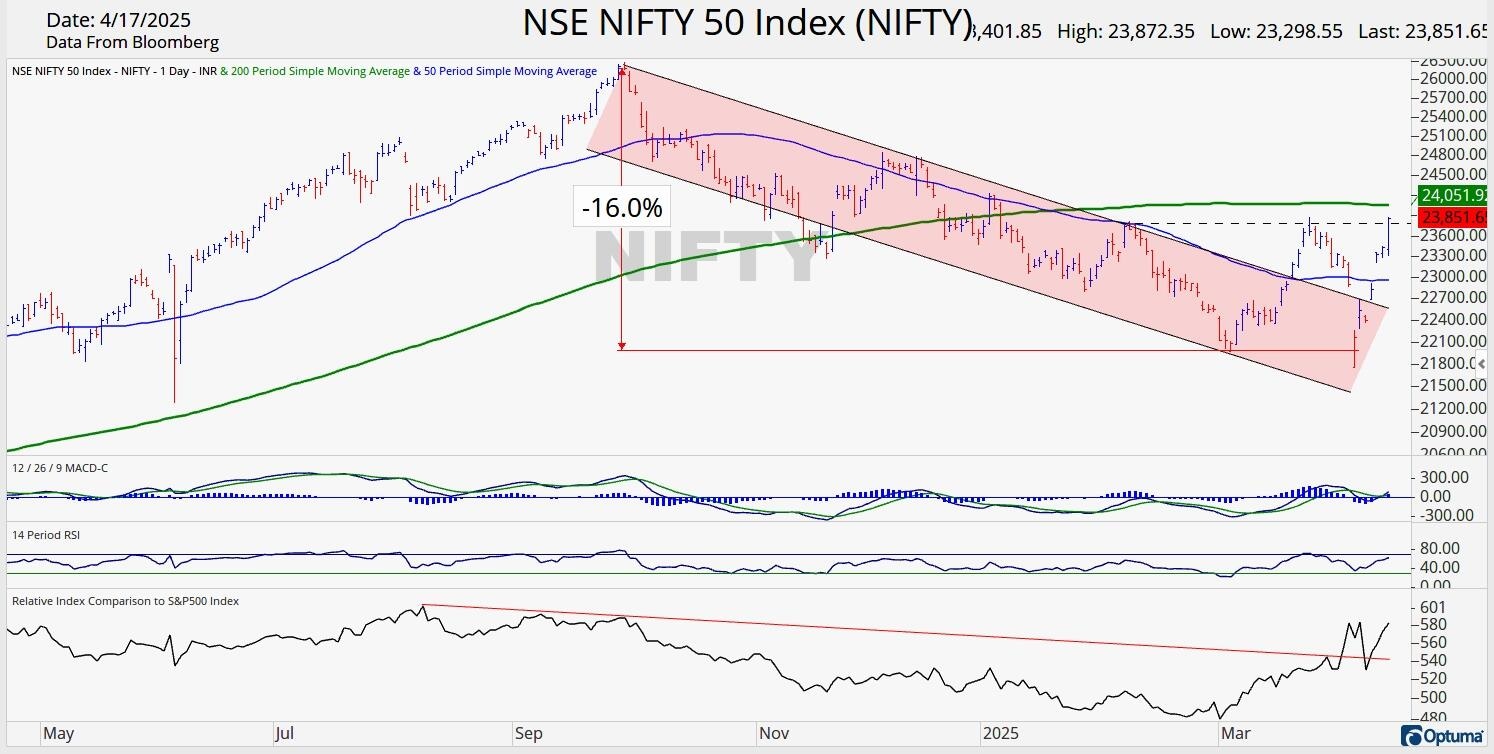
After reaching all-time highs in September of last year, the Nifty 50 trended downward in a channel showing classic signs of weakened investor demand. Lower highs were followed by lower lows, until a dark cross formed, and the index finally found its footing after a -16% drawdown. After breaking above the trend channel and the 50 Day MA, investors may have felt duped by the head fake in the lead up to the tariff announcements. As the index fell back below its March 4th bottom intraday, it quickly recovered while gapping up on multiple days into resistance, where it currently stands. Meanwhile, the RSI and the MACD are both improving, while the RIC is showing continued signs of strength vs. the S&P 500. While the Nifty 50 is sitting right at an important resistance level, and the 200 Day MA remains just a hair above that, any thrust and breakout above these levels would be a very bullish sign for the index. Should we get above these levels, the all-time high almost certainly comes back into play.
Unlock exclusive gold and silver trading signals and updates that most investors don’t see. Join our free newsletter now!
Author

CMT Association Research Team
CMT Association
The CMT Association is a global credentialing body that has served the financial industry for nearly 50 years.


