Results & Update: S&P 500 changes in trend window via a New Moon [Video]
![Results & Update: S&P 500 changes in trend window via a New Moon [Video]](https://editorial.fxstreet.com/images/Markets/Equities/SP500/wall_street_nyse4-637299025173341169_XtraLarge.jpg)
Recap 9/23 - The S&P opened with an 31 handle gap down and then traded another 64 handles lower into an 12:31 AM low.
From that low, the S&P rallied 23 handles into a 1:19 PM high. From that high, the S&P declined 38 handles into a 2:59 PM low of the day.
From that low, the S&P rallied 48 handles into the close
9/22 – The major indices had a very large down day finishing per the following closes: DJIA – 486.87; S&P 500 – 64.76; and the
Nasdaq Comp. - 198.88.
Looking ahead – We are now in the 9/23 AC change in trend window via a New Moon. Friday was the fourth consecutive down day and a very large day down. A large decline into a change in trend window is potentially a set up for a low. The one caveat is that the S&P rallied strongly into Friday’s close. This may reduce the effectiveness of this set up. An ideal scenario is for a strong down move into the first 30 – 60 minutes on Monday and then the markets finds support and reverses to the upside. Friday’s low was just about 10 handle higher than the June 17 low, which is the low of the year. A test of or breaking that low in the first hour and then finding support should be constructive for an ideal low. Keep in mind, we also have a change in trend due 9/26 AC, which could complicate the picture. Perhaps the more bullish scenario is for a low and then a sideways trading range into the Tuesday change in trend window for a two day low. A strong rally into Monday’s close and Tuesday’s open could set up a high. One feather in the Bull’s cap now is that the NOW IINDEX
has moved to a rare Buy Signal. Please see details below.
The Now Index has moved to the BUY ZONE. This is a rare outright buy signal and indicates the probability for a rally within one
trading day, due to an imbalance of too many shorts.
Coming Events:
(Stocks potentially respond to all events).
2 G. 9/23 AC – New Moon in Libra. Major change in trend Financials, Grains, Precious Metals, Sugar, Wheat.
- A. 9/26 AC – Moon’s North Node Contra-Parallel US Moon. Major change in trend US Stocks, T-Bonds, US Dollar.
- 9/28 AC – Jupiter 45 Uranus. Moderate change in trend Cattle, Copper, Cotton, Oats.
- 9/29 AC – Moon’s North Node Contra-Parallel US Saturn. Major change in trend US Stocks, T-Bonds, US Dollar.
- 9/30 AC – Jupiter 45 US Moon. Moderate change in trend US Stocks, T-Bonds, US Dollar.
- 9/30 AC – Mercury in Virgo turns Direct. Major change in trend Corn, Oats, SOYBEANS, Wheat.
- 9/30 AC – Mercury 0 North Latitude. Major change in trend Corn, Oats, Soybeans, Wheat.
- 10/03AC – Saturn Parallel US Moon. Major change in trend US Stocks, T-Bonds, US Dollar.
Market Math –
9/30 = 5,468 (Music) days > 10/11/2007 MAJOR HIGH
Fibonacci – 9/27
*DJIA – 9/27
*NYSE – 9/26
Astro – 9/26, 9/27, *9/30 AC
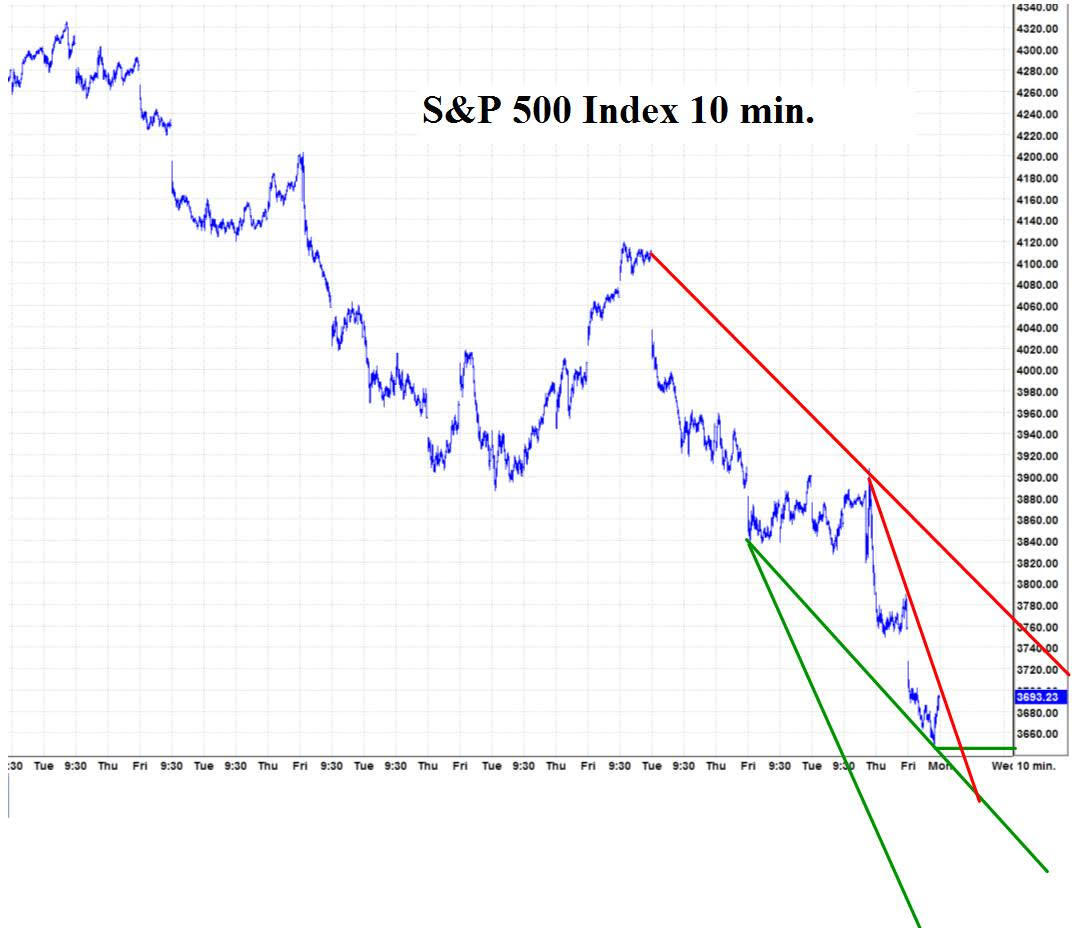
Please see below the S&P 500 10 minute chart.
Support - 3637 Resistance – 3700, 3820
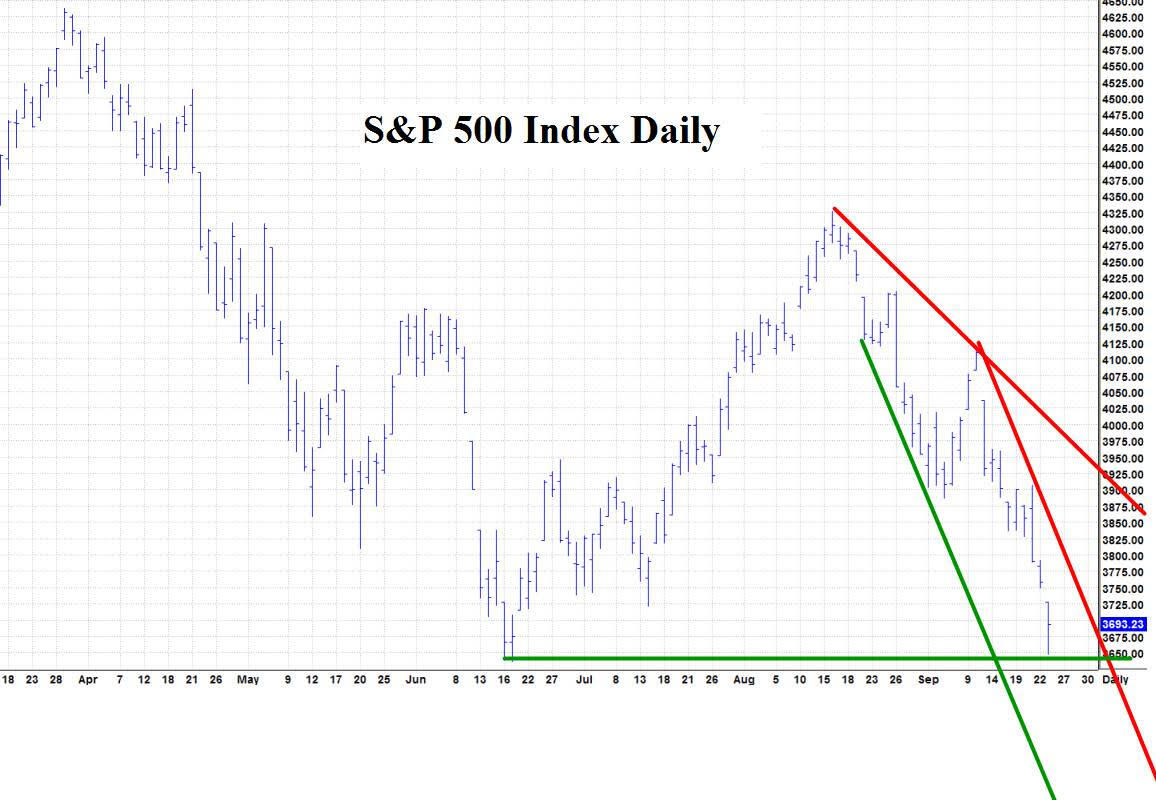
Please see below the S&P 500 Daily chart
Support - 3637 Resistance – 3700, 3820
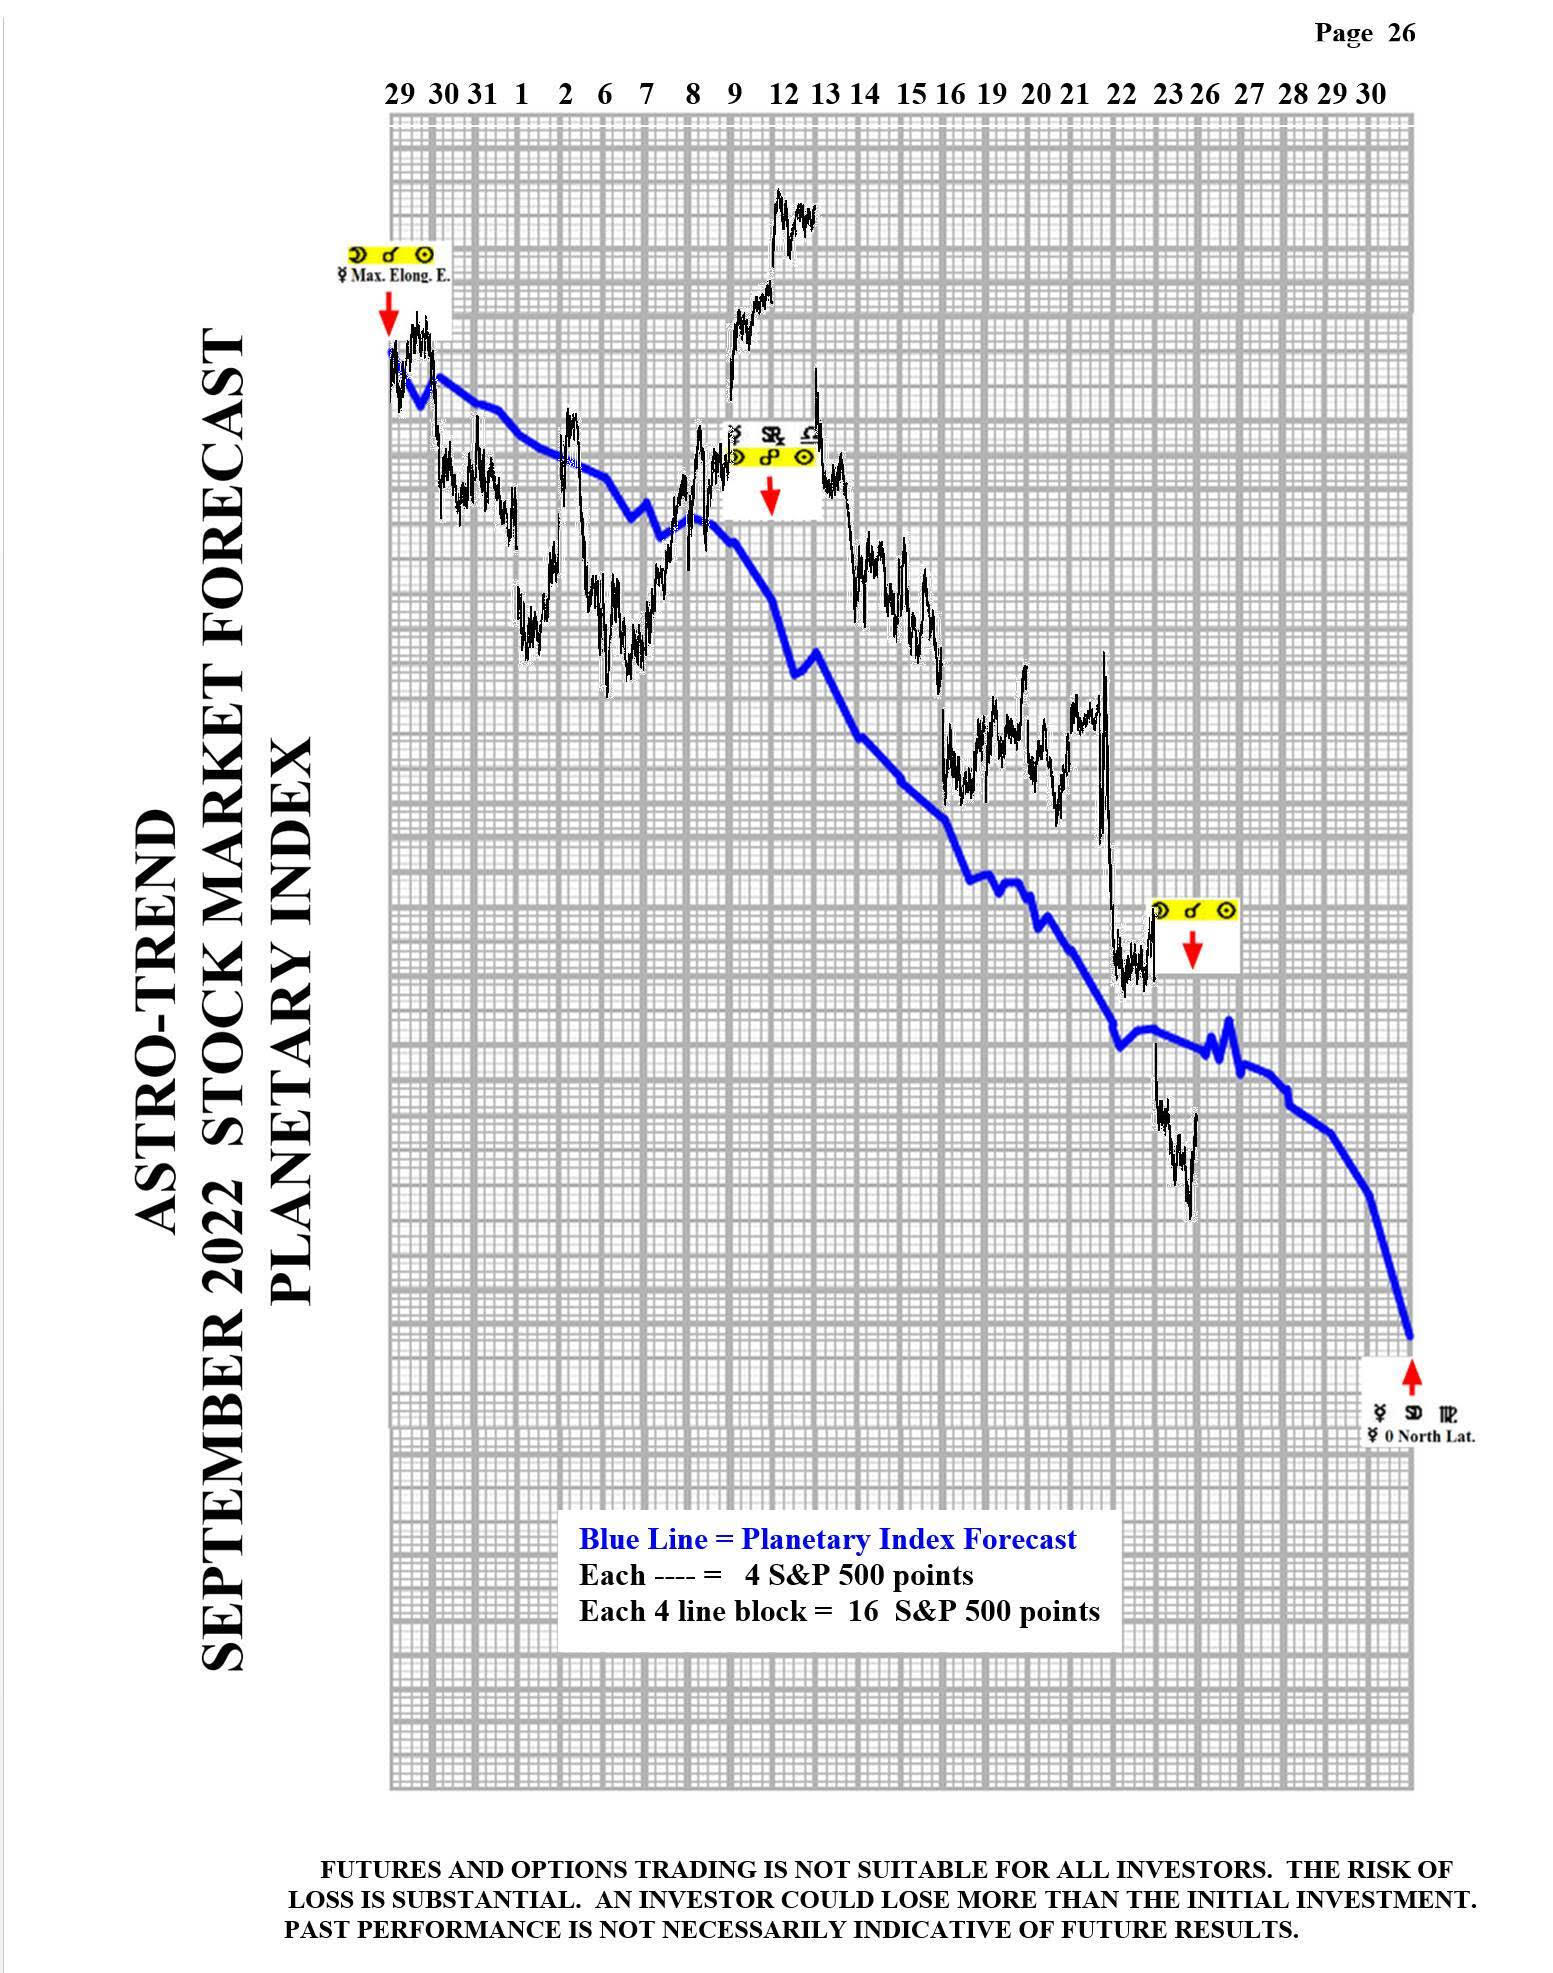
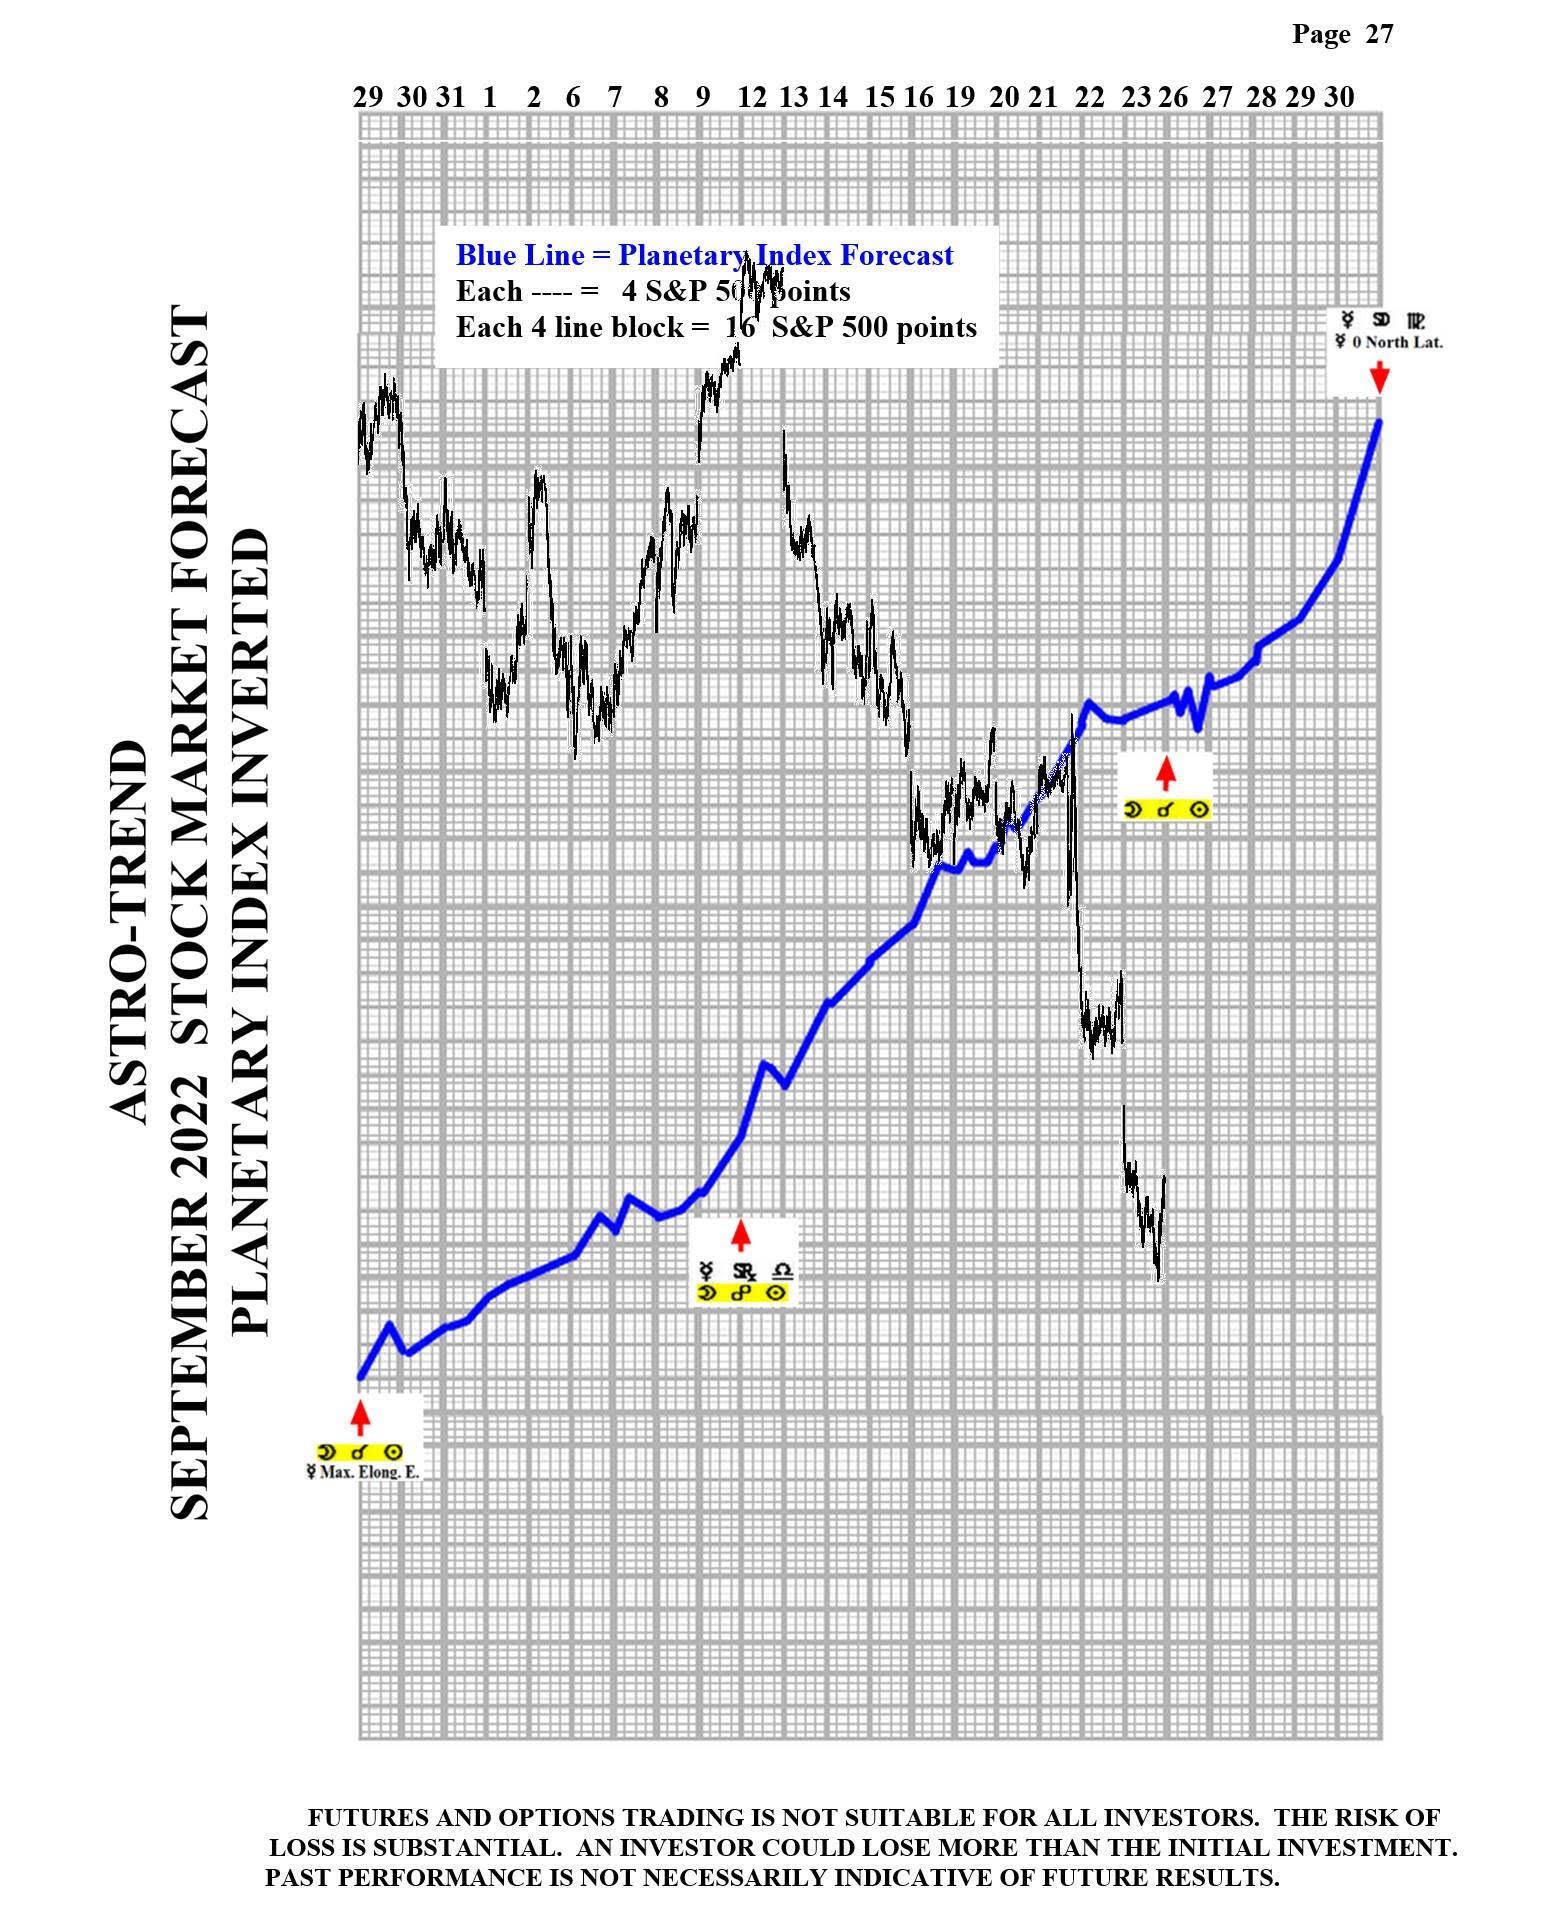
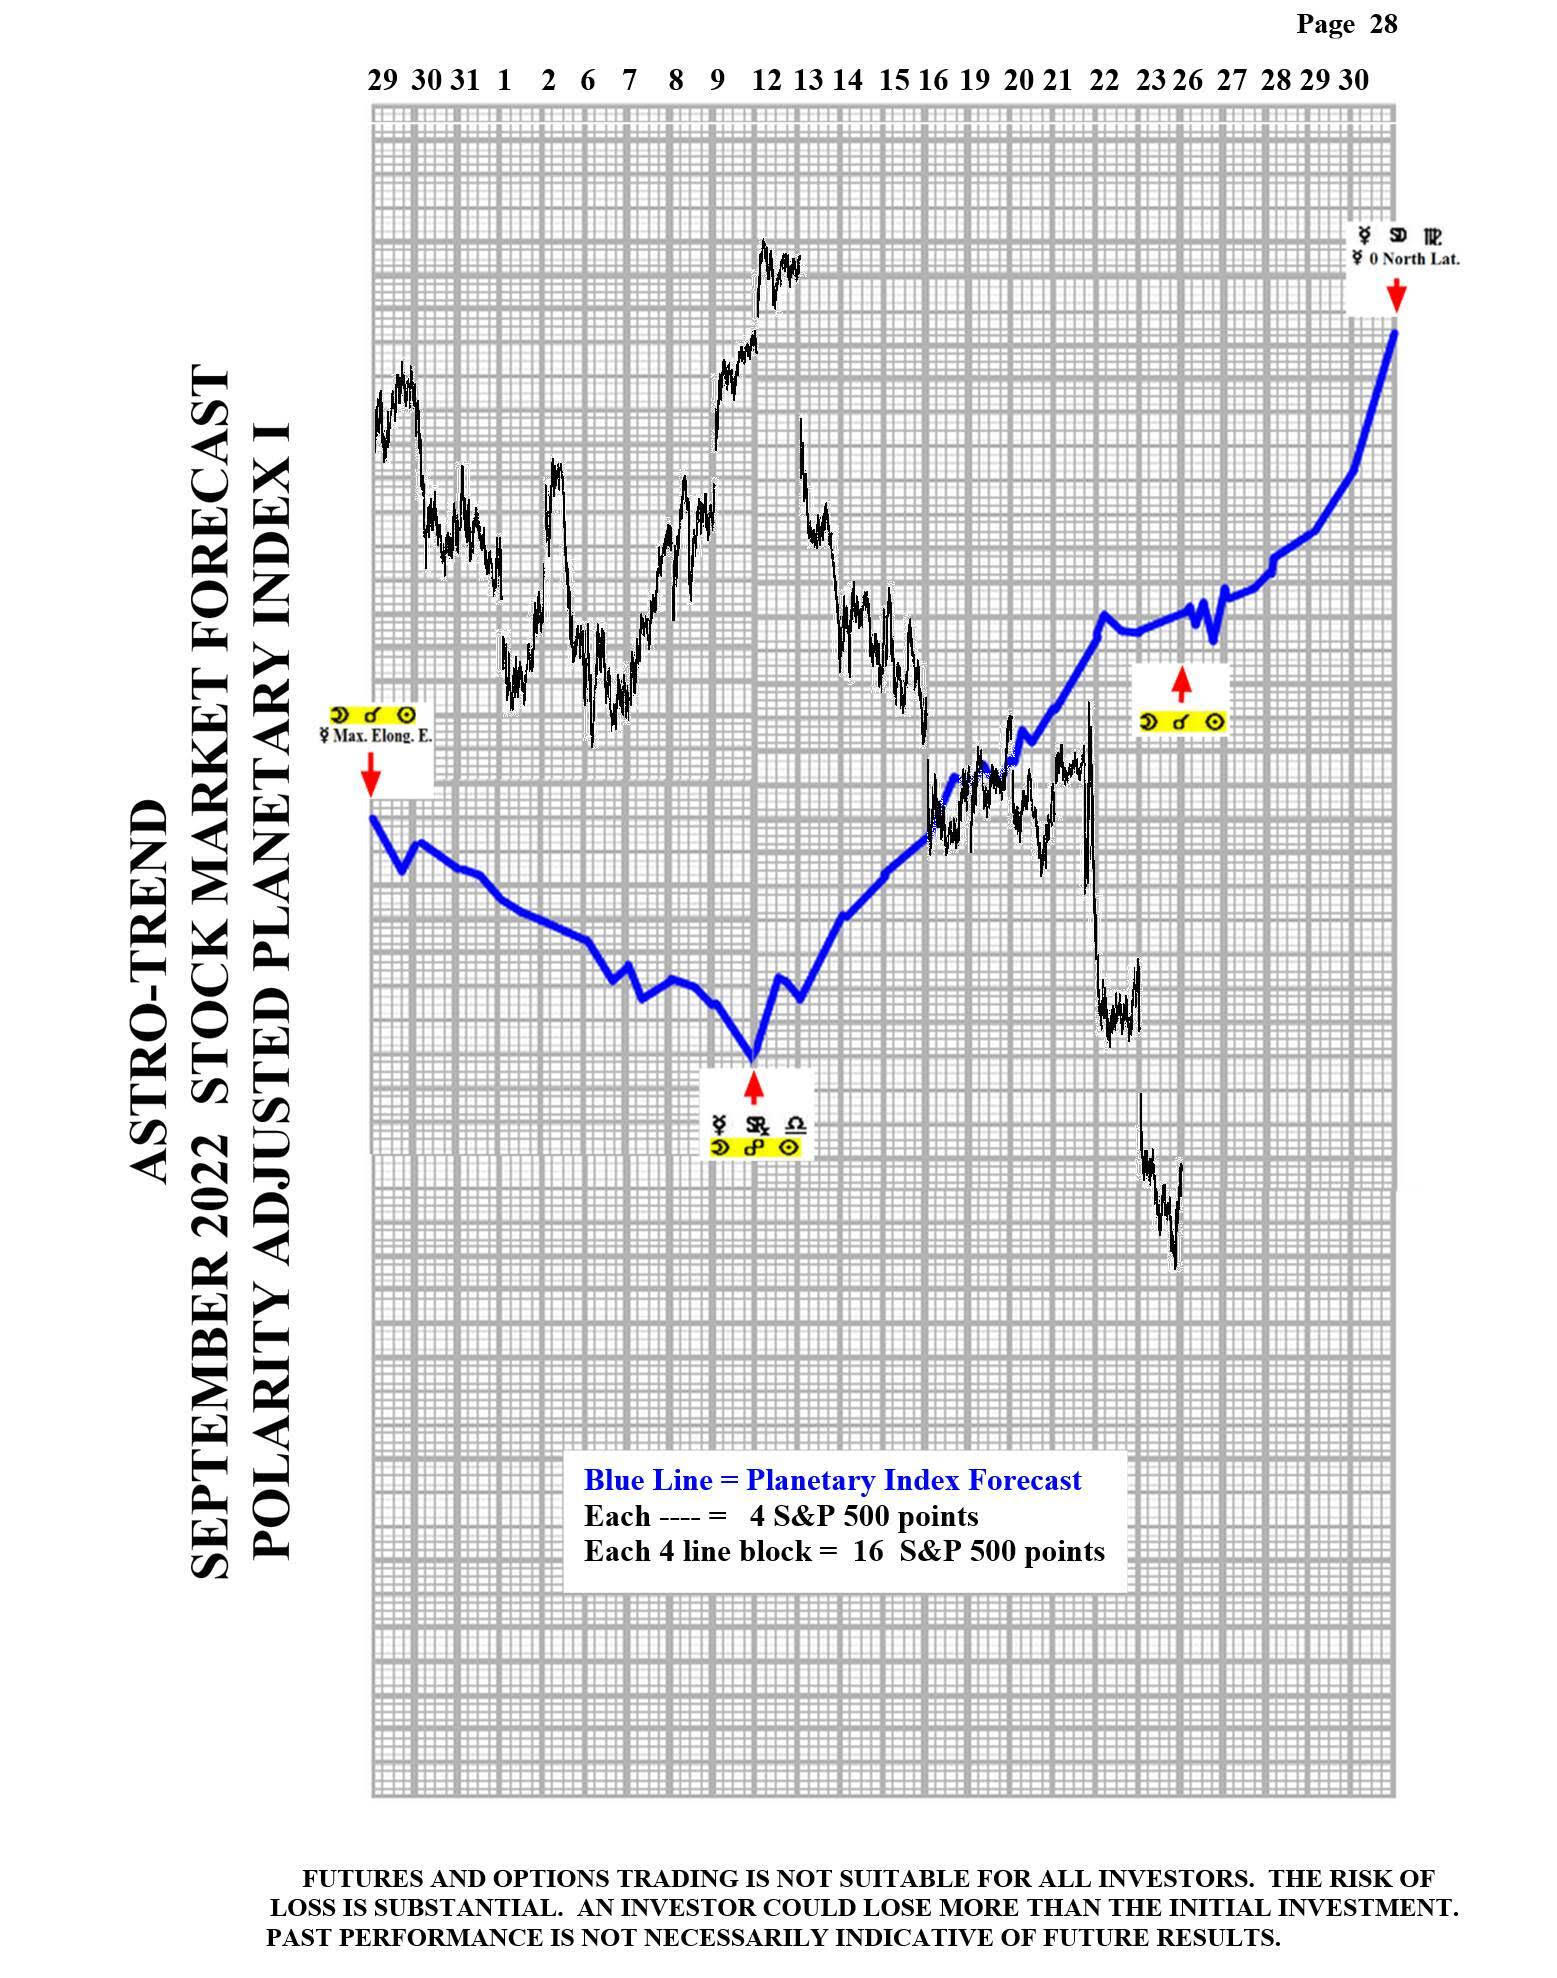
Please see below the September Planetary Index charts with S&P 500 10 minute bars for results.

Interviewed Norm Winski
Author

Norm Winski
Independent Analyst
www.astro-trend.com


