Resistance eyed on AUD/USD

AUD/USD bears outperformed in January, guiding the major pair nearly 250 pips lower, or -3.5%.
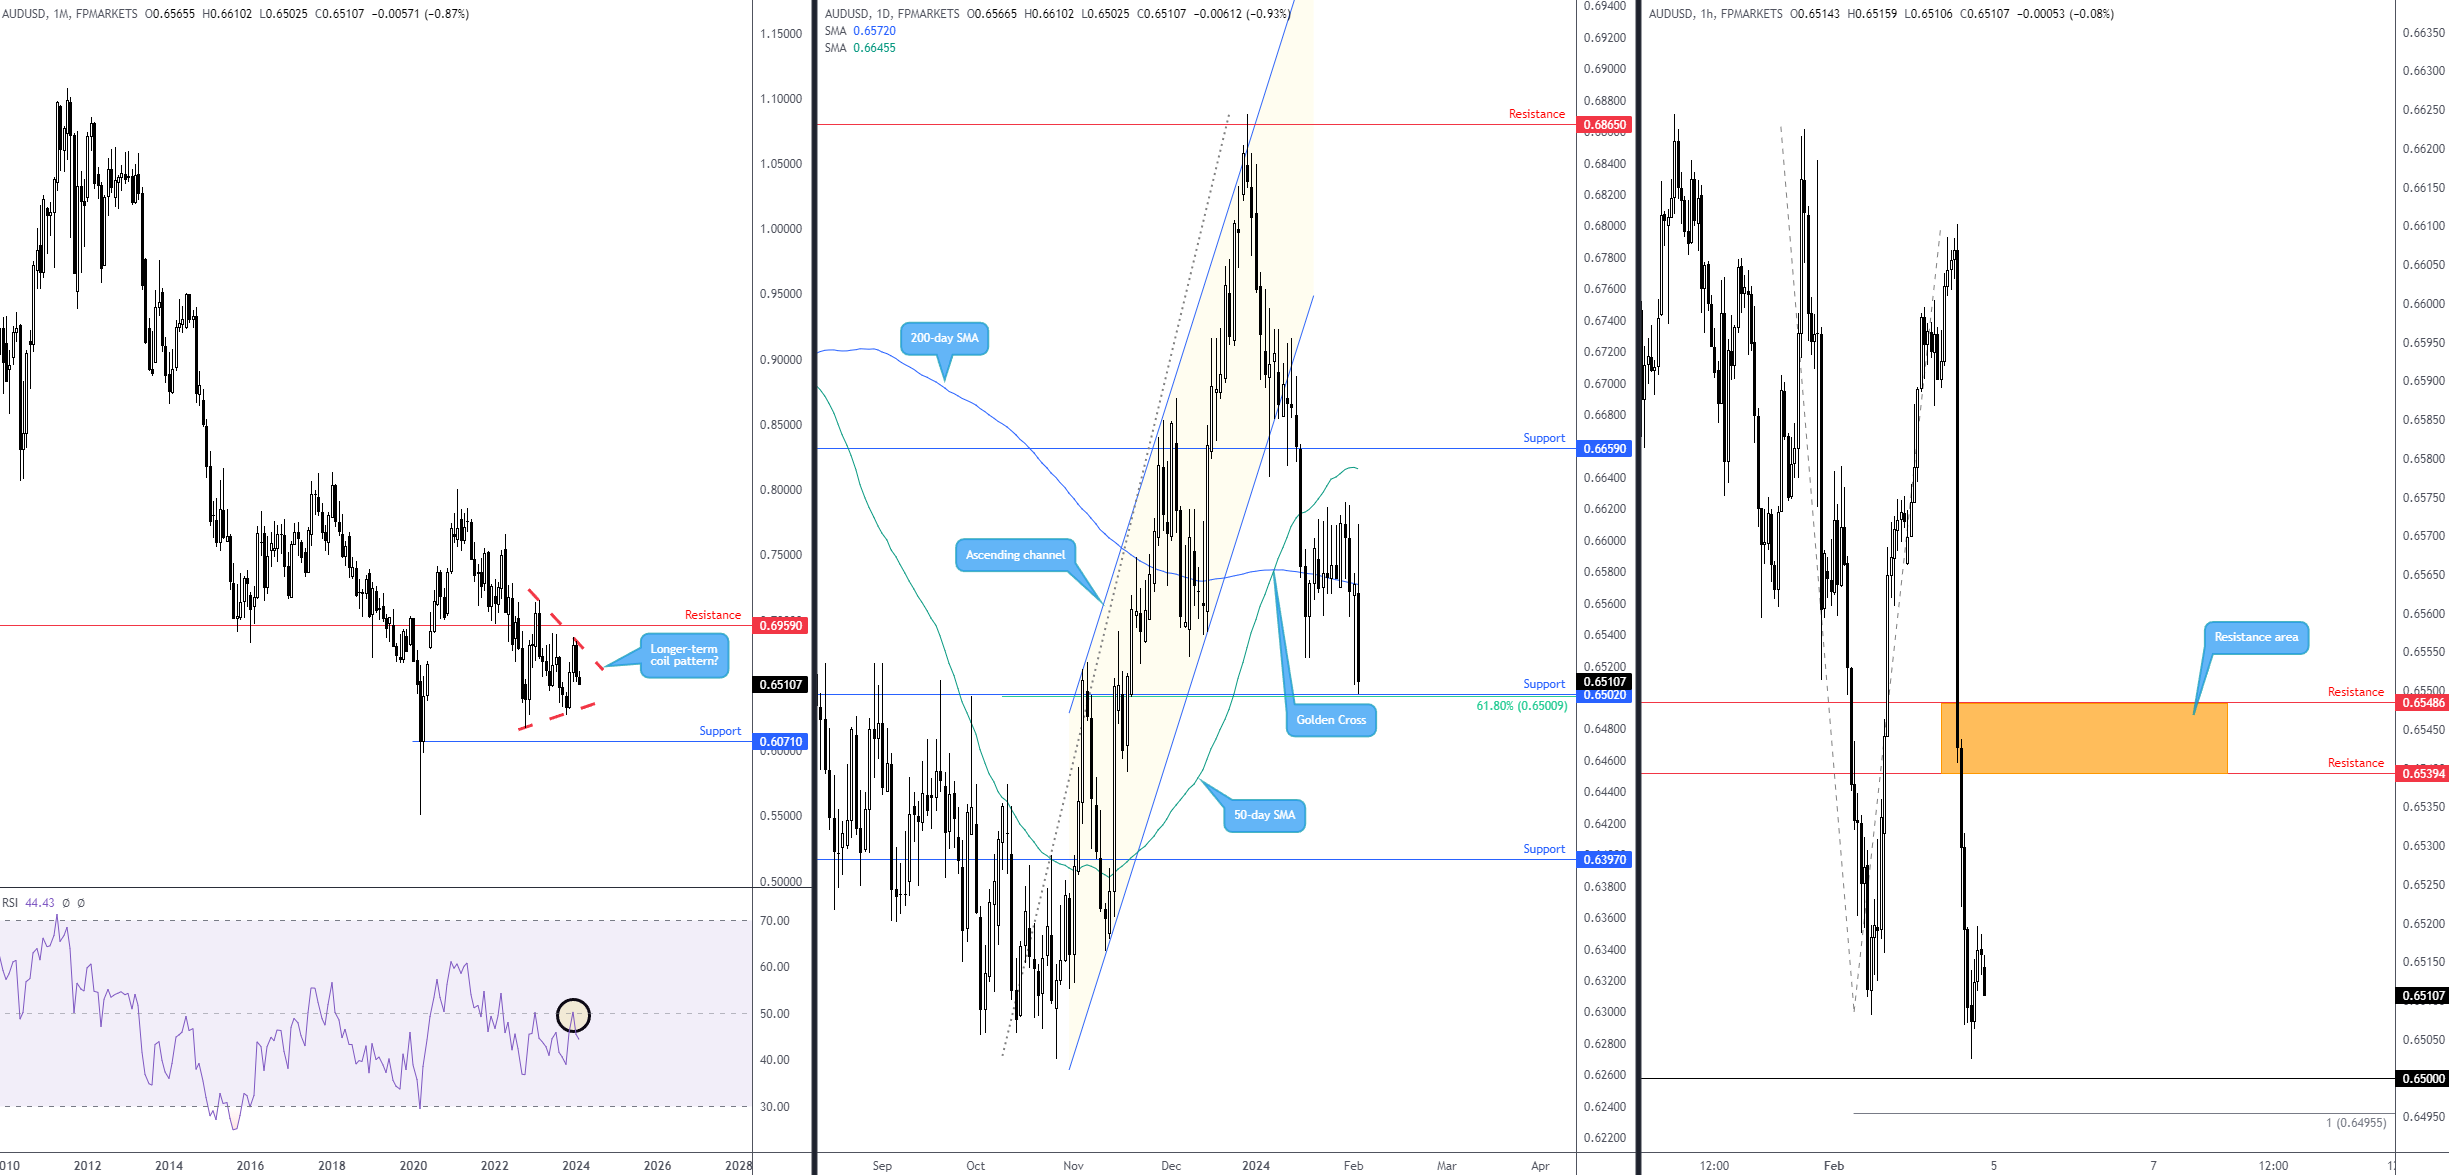
Monthly coil in play
From the monthly timeframe, things have been consolidating between two converging lines ($0.7158 and $0.6170) since late 2022. The fact that there is not a steep pole that precedes the formation, this pattern has been identified as a symmetrical triangle (or coil) rather than a bearish pennant.
With price fading the upper boundary of this pattern, bears have room to stretch their legs this week/month to the pattern’s lower boundary. Additional technical structure to be aware of on the longer-term chart can be seen from support at $0.6071 and resistance at $0.6959. Another important technical observation for the currency pair on the monthly scale is the Relative Strength Index (RSI) rejecting the lower side of the 50.00 centreline in late 2023, signalling that average losses continue to exceed average gains: negative momentum.
Daily support vulnerable
Having acknowledged price action fading the upper boundary of a coil pattern on the monthly chart, with scope to extend losses, price movement on the daily chart ventured beneath its 200-day simple moving average (SMA) in the second half of last week ($0.6572), a bearish trend signal (current price is BELOW is 200-day average price). Support on the daily chart is nearby at $0.6502, joined by a 61.8% Fibonacci retracement ratio at $0.6501. The 200-day SMA could potentially deliver dynamic resistance this week; therefore, should the pair engulf $0.6502, the door appears to be pretty much open for breakout sellers to change gears to target as far south as support coming in at $0.6397.
H1 resistance on the radar this week
Meanwhile, on the H1 chart, we can see a fresh lower low printed on Friday, touching levels not seen since November 2023. This places the $0.65 handle in close proximity this week, shadowed by neighbouring support in the form of a 100% projection ratio at $0.6496 taken from $0.6623, $0.6508 and $0.6610. You may also recognise that this level aligns closely with the daily support mentioned above at $0.6502 and the 61.8% Fibonacci retracement ratio at $0.6501.
With the above in mind, the monthly timeframe demonstrates scope to continue pressing lower until reaching the lower boundary of the symmetrical triangle, which could imply that daily support from $0.6502 is in a vulnerable position. As a result, any pullback seen this week may be sold, particularly if the pullback meets H1 resistance between $0.6549 and $0.6539.
Source: TradingView
Author

Aaron Hill
FP Markets
After completing his Bachelor’s degree in English and Creative Writing in the UK, and subsequently spending a handful of years teaching English as a foreign language teacher around Asia, Aaron was introduced to financial trading,


