Replication is not duplication

S2N spotlight
Unsurprisingly, I have a contrarian view of the latest craze in the hedge fund/CTA (managed futures) space.
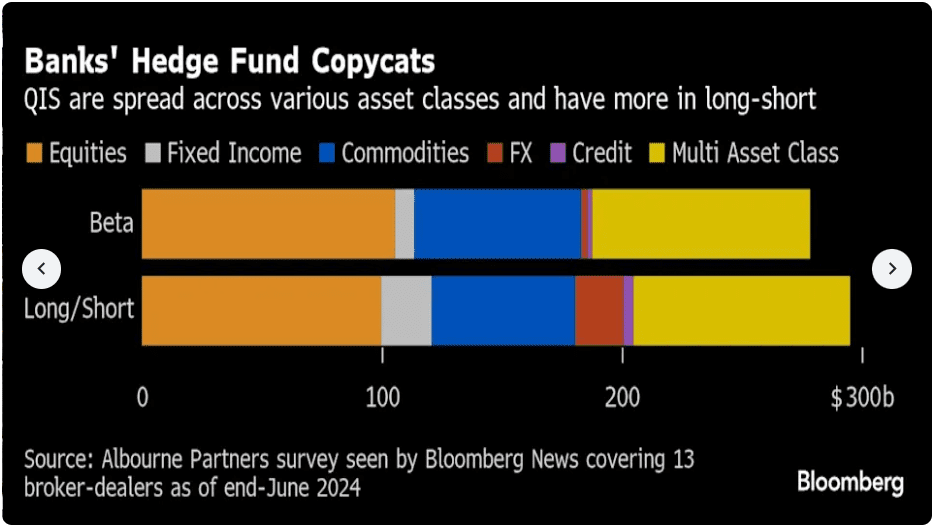
A JP Morgan Chase & Co. quant unit has amassed a $100 billion derivatives-powered trading book, offering hedge fund-like investing on the cheap to investors of all stripes.
Quantitative Investment Strategies, or QIS, is the latest craze in the investment space, where popular strategies are being replicated in mass production by bank trading desks. This is where I may sound like I am contradicting myself. I am very much in favour of low-cost index funds where ETFs or similarly structured notes replicate an index to provide an index return.
QIS units across 13 broker-dealers were estimated to be managing around $573 billion as of June last year. I think the jury is still out on these replication strategies.
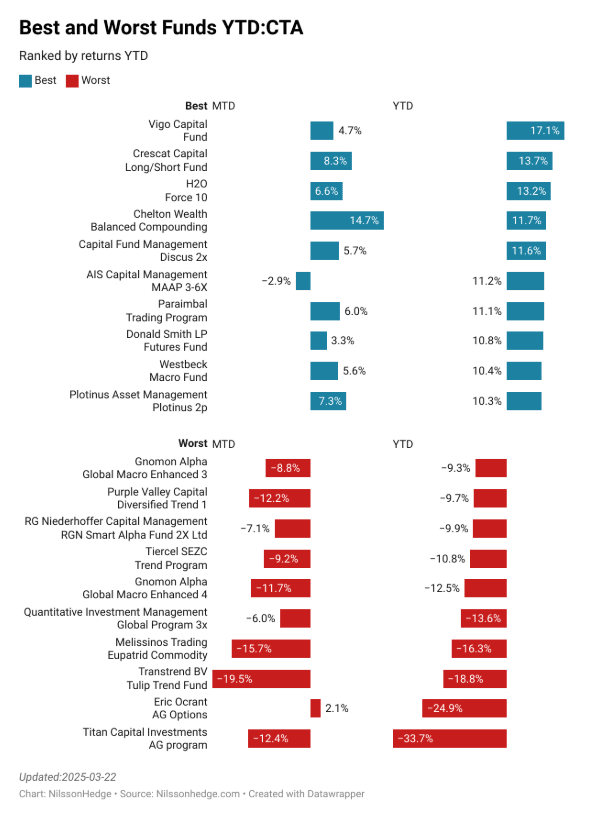
To me, there are so many variations to a simple momentum-based strategy like the 50-day moving average crossing the 200-day. To make my point, I looked at the year-to-date performance of the top 10 best and worst CTAs managing $100 million or more this year. As you can see, these so-called similar strategies have wildly different results. I am by no means an expert in this area, but I think this could be a case of you get what you pay for. I know if there was a crisis in the markets, I would want someone looking after my assets as if they were his/her own. I also cannot see how you can extract that extra bit of juice if you are using the same models for all your clients. It seems like this is just an attempt to capture the bulk of the strategy’s performance at a reasonable cost.
To scratch the itch this article has caused me, I am going to do a little experiment. I am going to look at some futures contracts and see if there are pricing anomalies. My thesis is I will find some small exploitable statistical arbitrage that none of these big QIS desks will be able to exploit due to their size. I promise I will present my answer without editing this section.
Here are my findings. I just tried with 3 futures chains; I am sure similar results will appear across the entire universe of futures. The results were a little different from what I expected, but interesting.
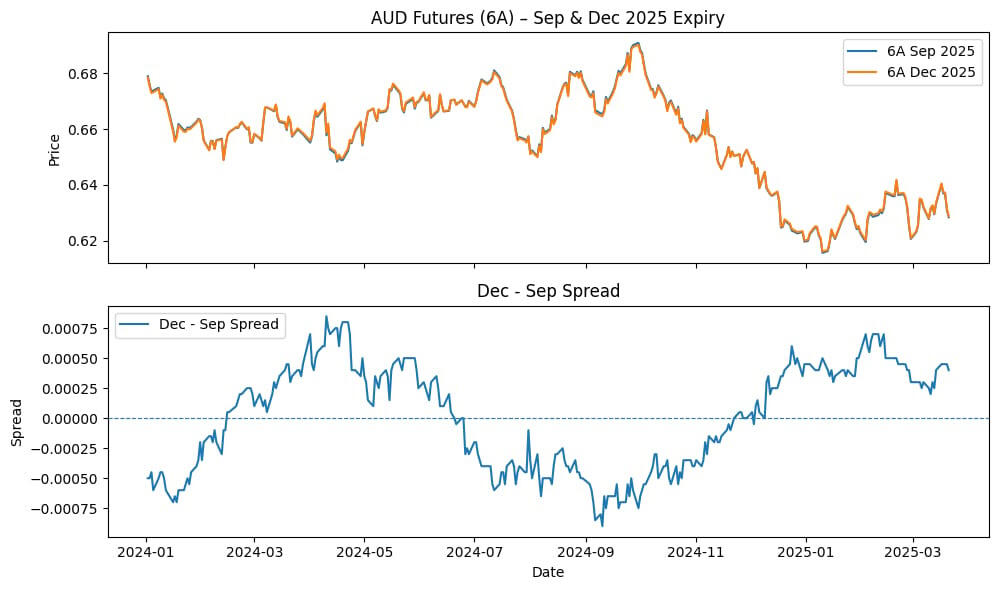
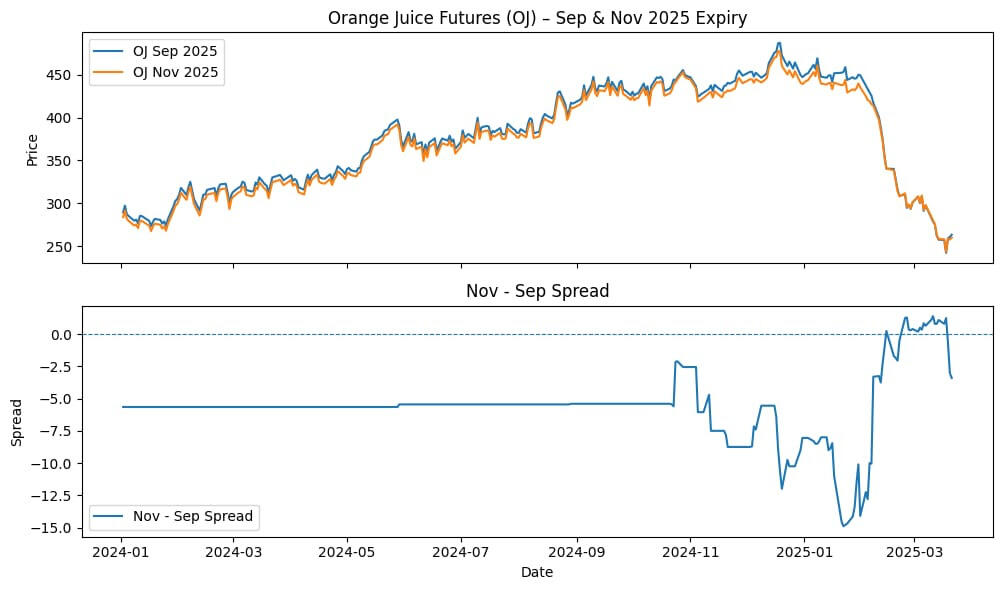
Here is what I did I took the Aussie Dollar future 6A and looked at the price action of the September 2025 expiry and the December 2025 expiry from the 1st of January 2024. As you can see in the top chart, the 2 series look almost exactly the same, as they should; the only difference is the expiry month. The blue line in the subplot shows the difference between the 2. There should not be much of a difference, and if there is, it should relate to the interest rate differential and should be consistent. There seems to be a trading opportunity here. I will need to do a lot more homework and build a proper model before stating that with confidence.
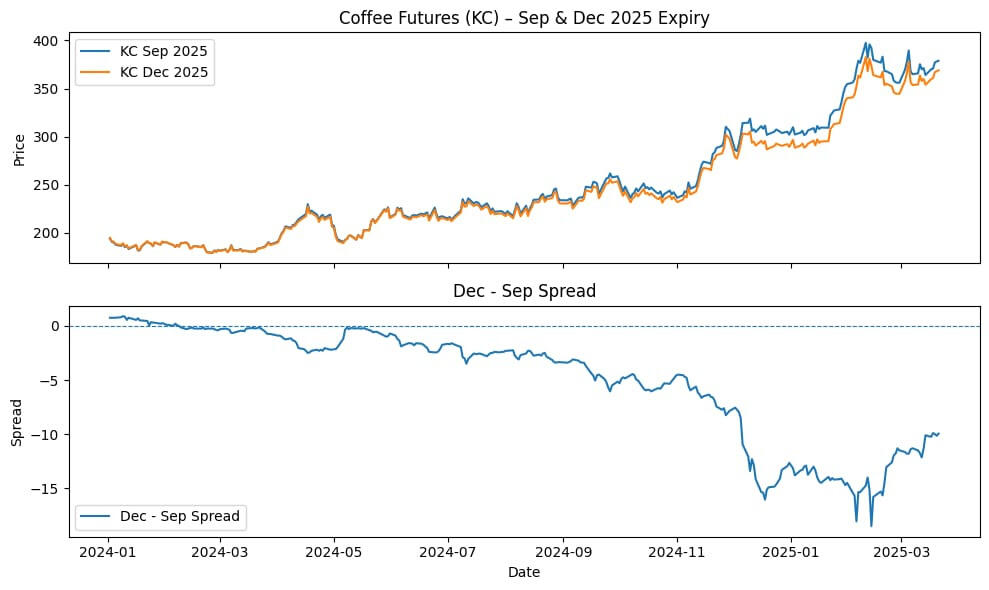
Coffee futures are producing a seemingly big trade opportunity. Clearly I don’t know enough about these commodity types, as there could be seasonal or drought-related issues I am unaware of causing the large spreads.
The way Orange Juice traded throughout 2024 is how I was expecting to see all the charts, except for small blips. The bottom line is this is a fascinating area I knew nothing about an hour ago.
S2N observations
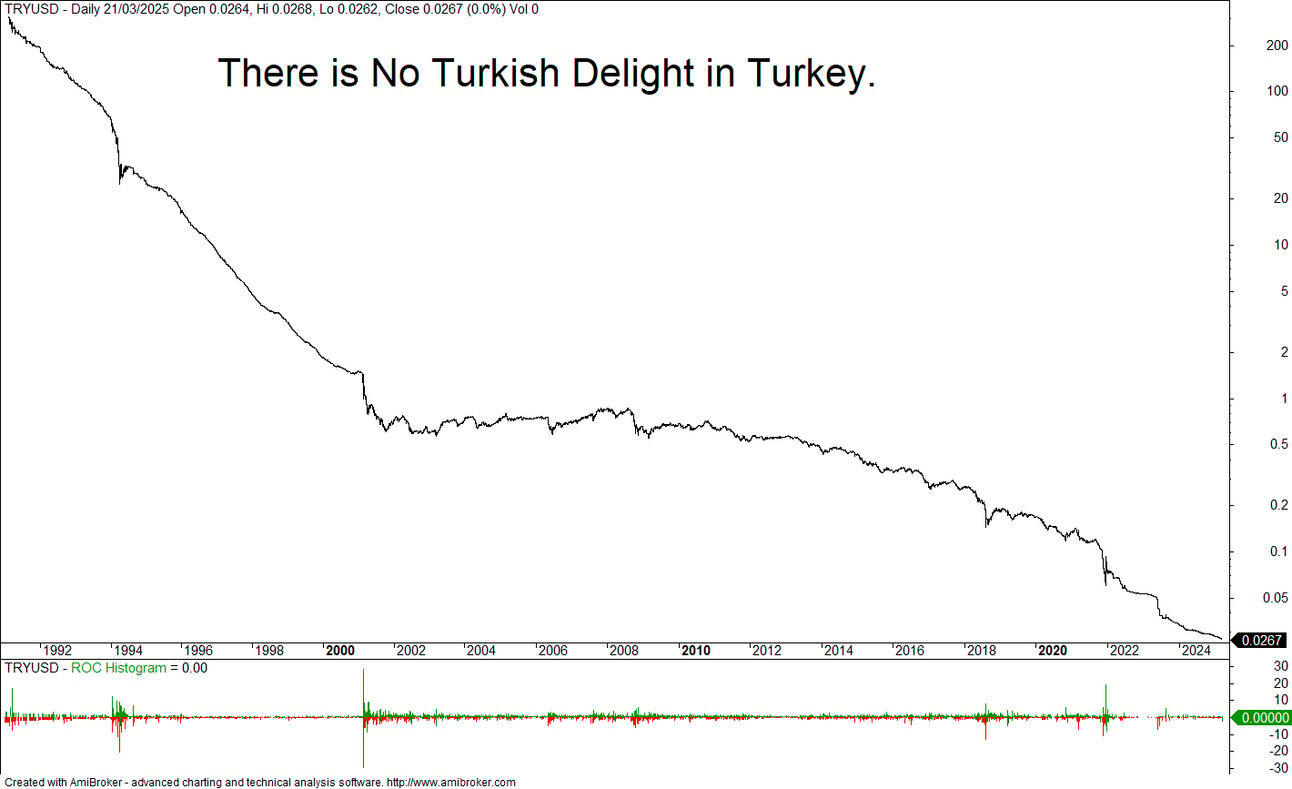
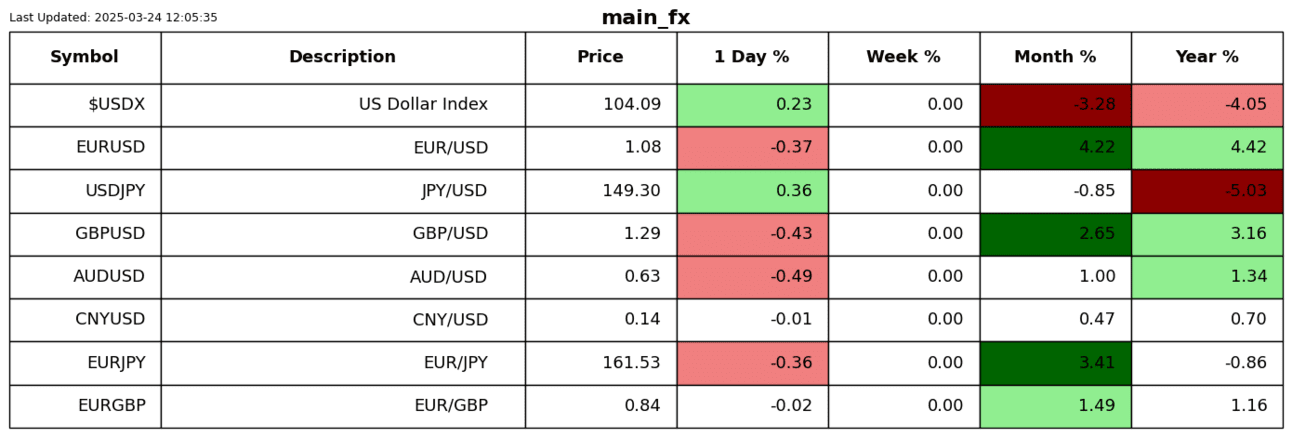
The Turkish lira continues to freefall. Erdogan just arrested his main opposition. The country is on the precipice of a civil war, adding to an already tense region and global geopolitical tensions.
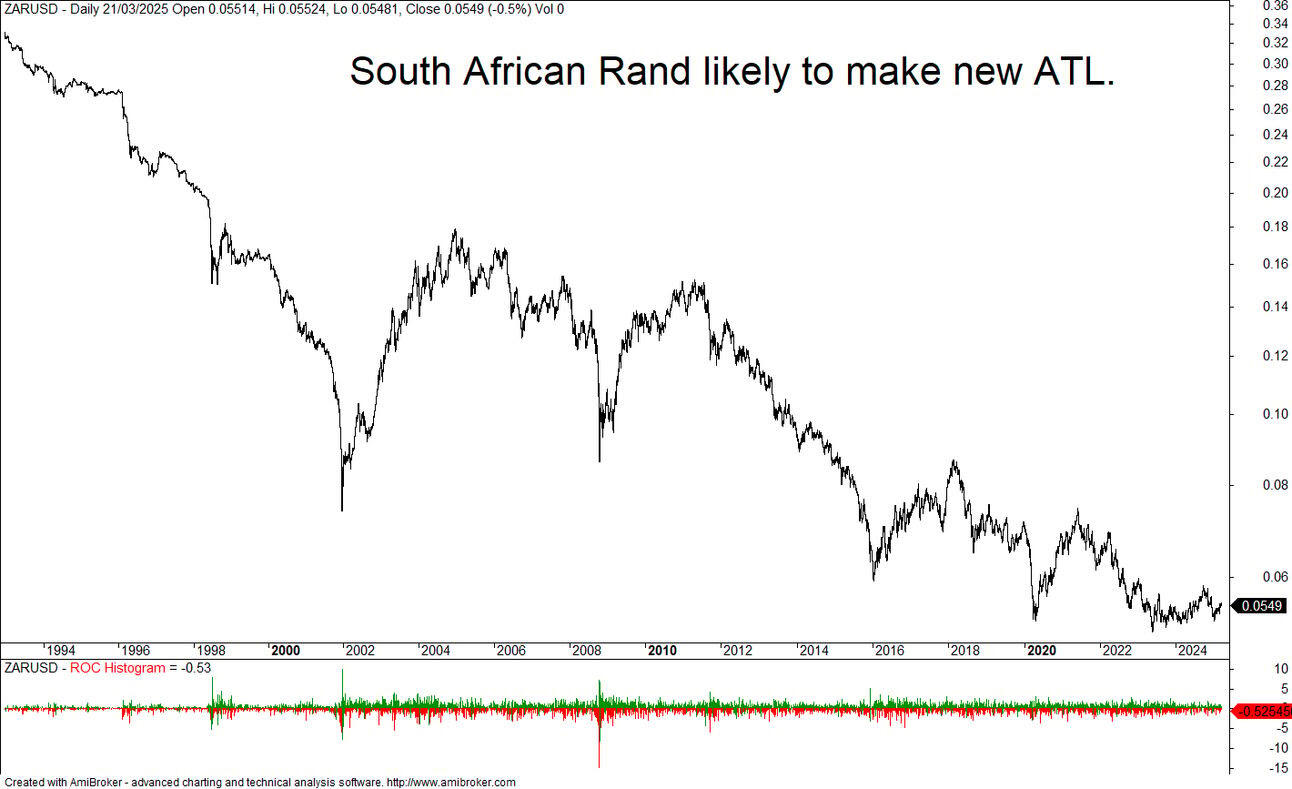
I think it won’t be long before the South African Rand joins Turkey, making new all-time lows. I would be going short the Rand at these levels.
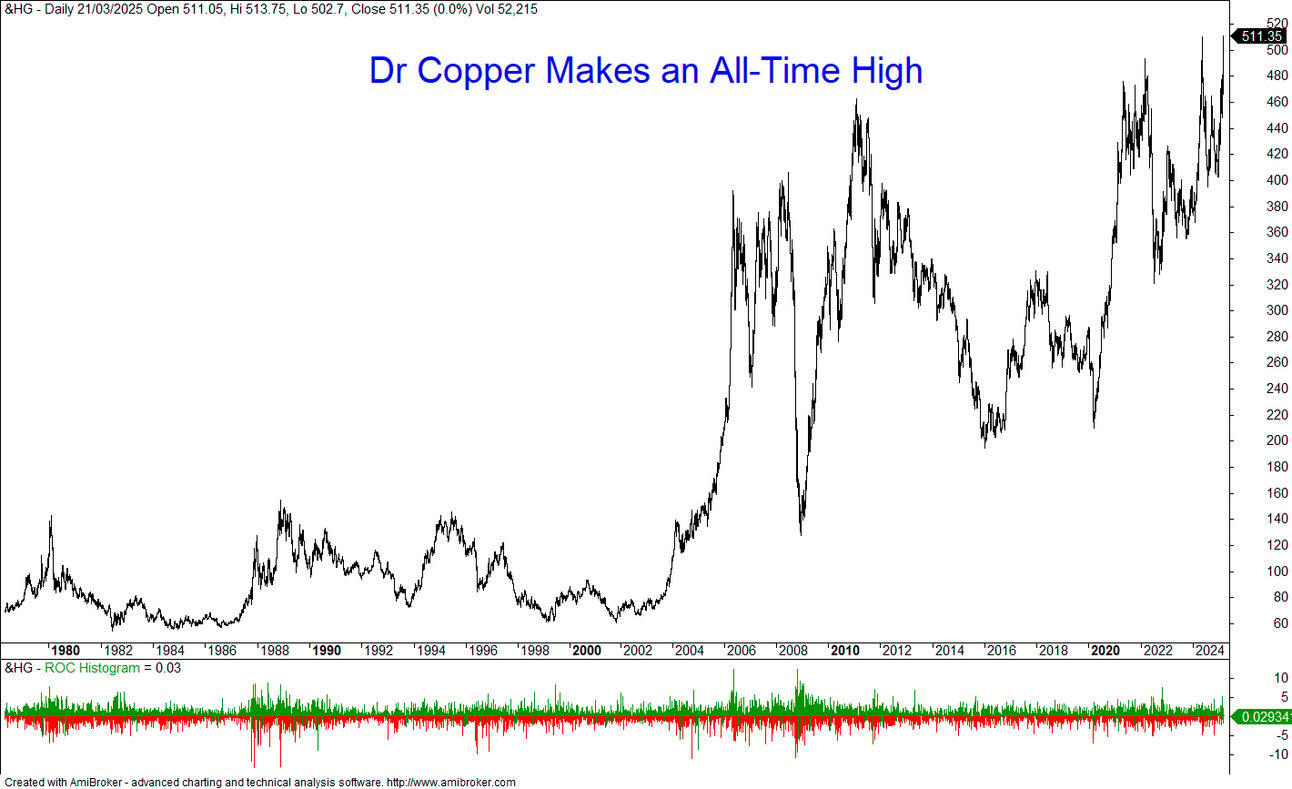
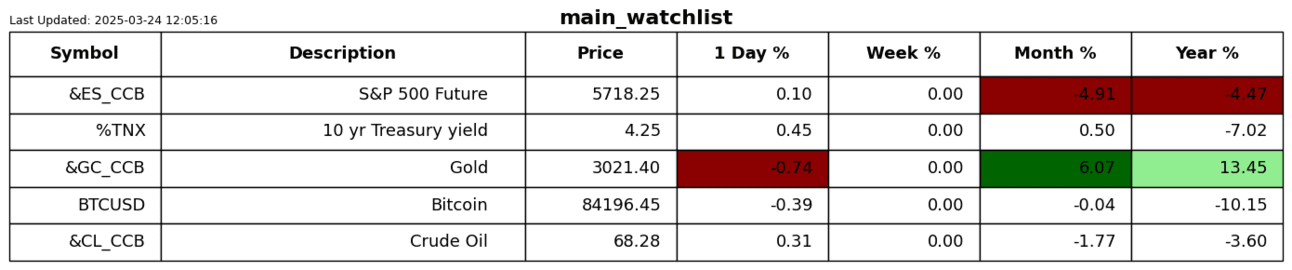
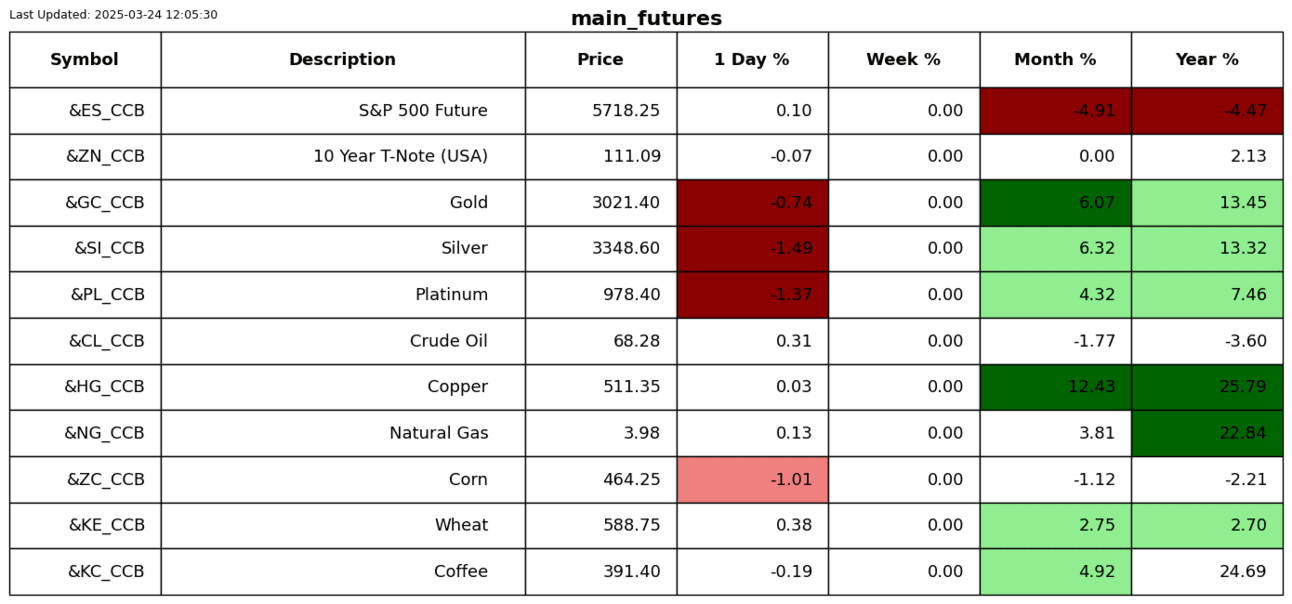
Dr. Copper made an all-time high on Friday. Copper is often seen as a lead indicator. I am not sure there is any science to support that, but it made an ATH nonetheless.
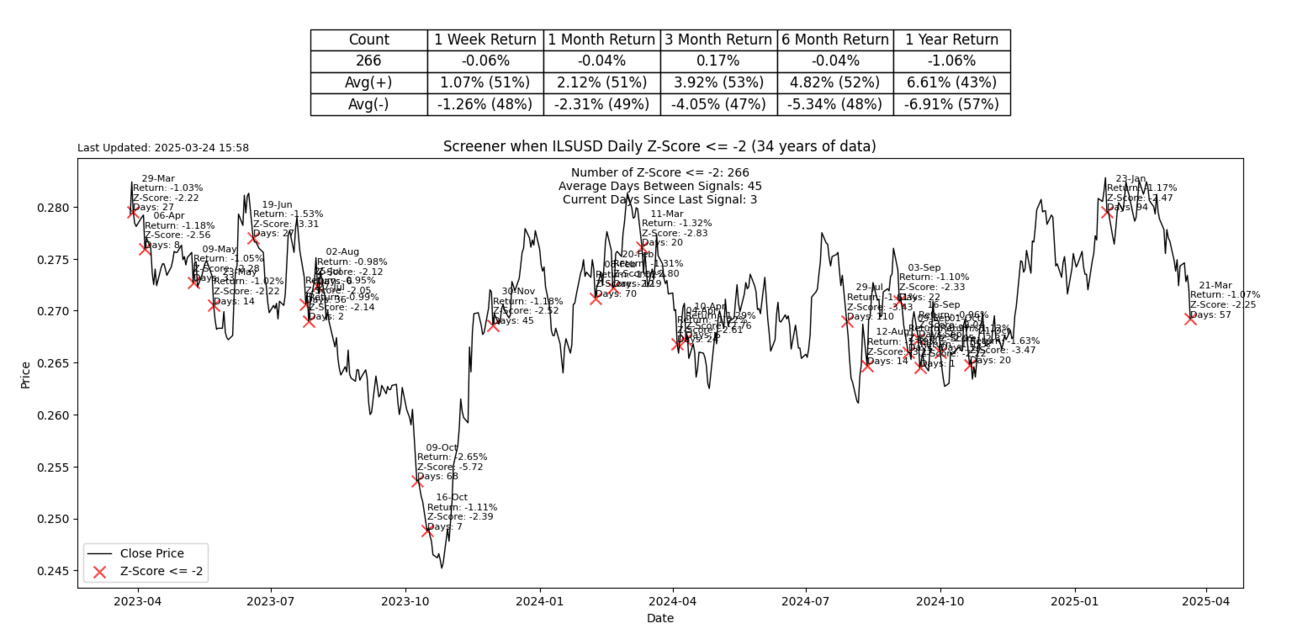
S2N screener alert
The Israeli shekel had a 2-sigma down day on Friday.
S2N performance review
S2N chart gallery
S2N news today

Author

Michael Berman, PhD
Signal2Noise (S2N) News
Michael has decades of experience as a professional trader, hedge fund manager and incubator of emerging traders.


