Rangebound conditions for the US Dollar

Despite generous economic data last week, the US Dollar Index was tiresome. The week settled marginally higher, adding +0.2%, but it barely scratched out a fresh higher high and largely remained within the previous range.
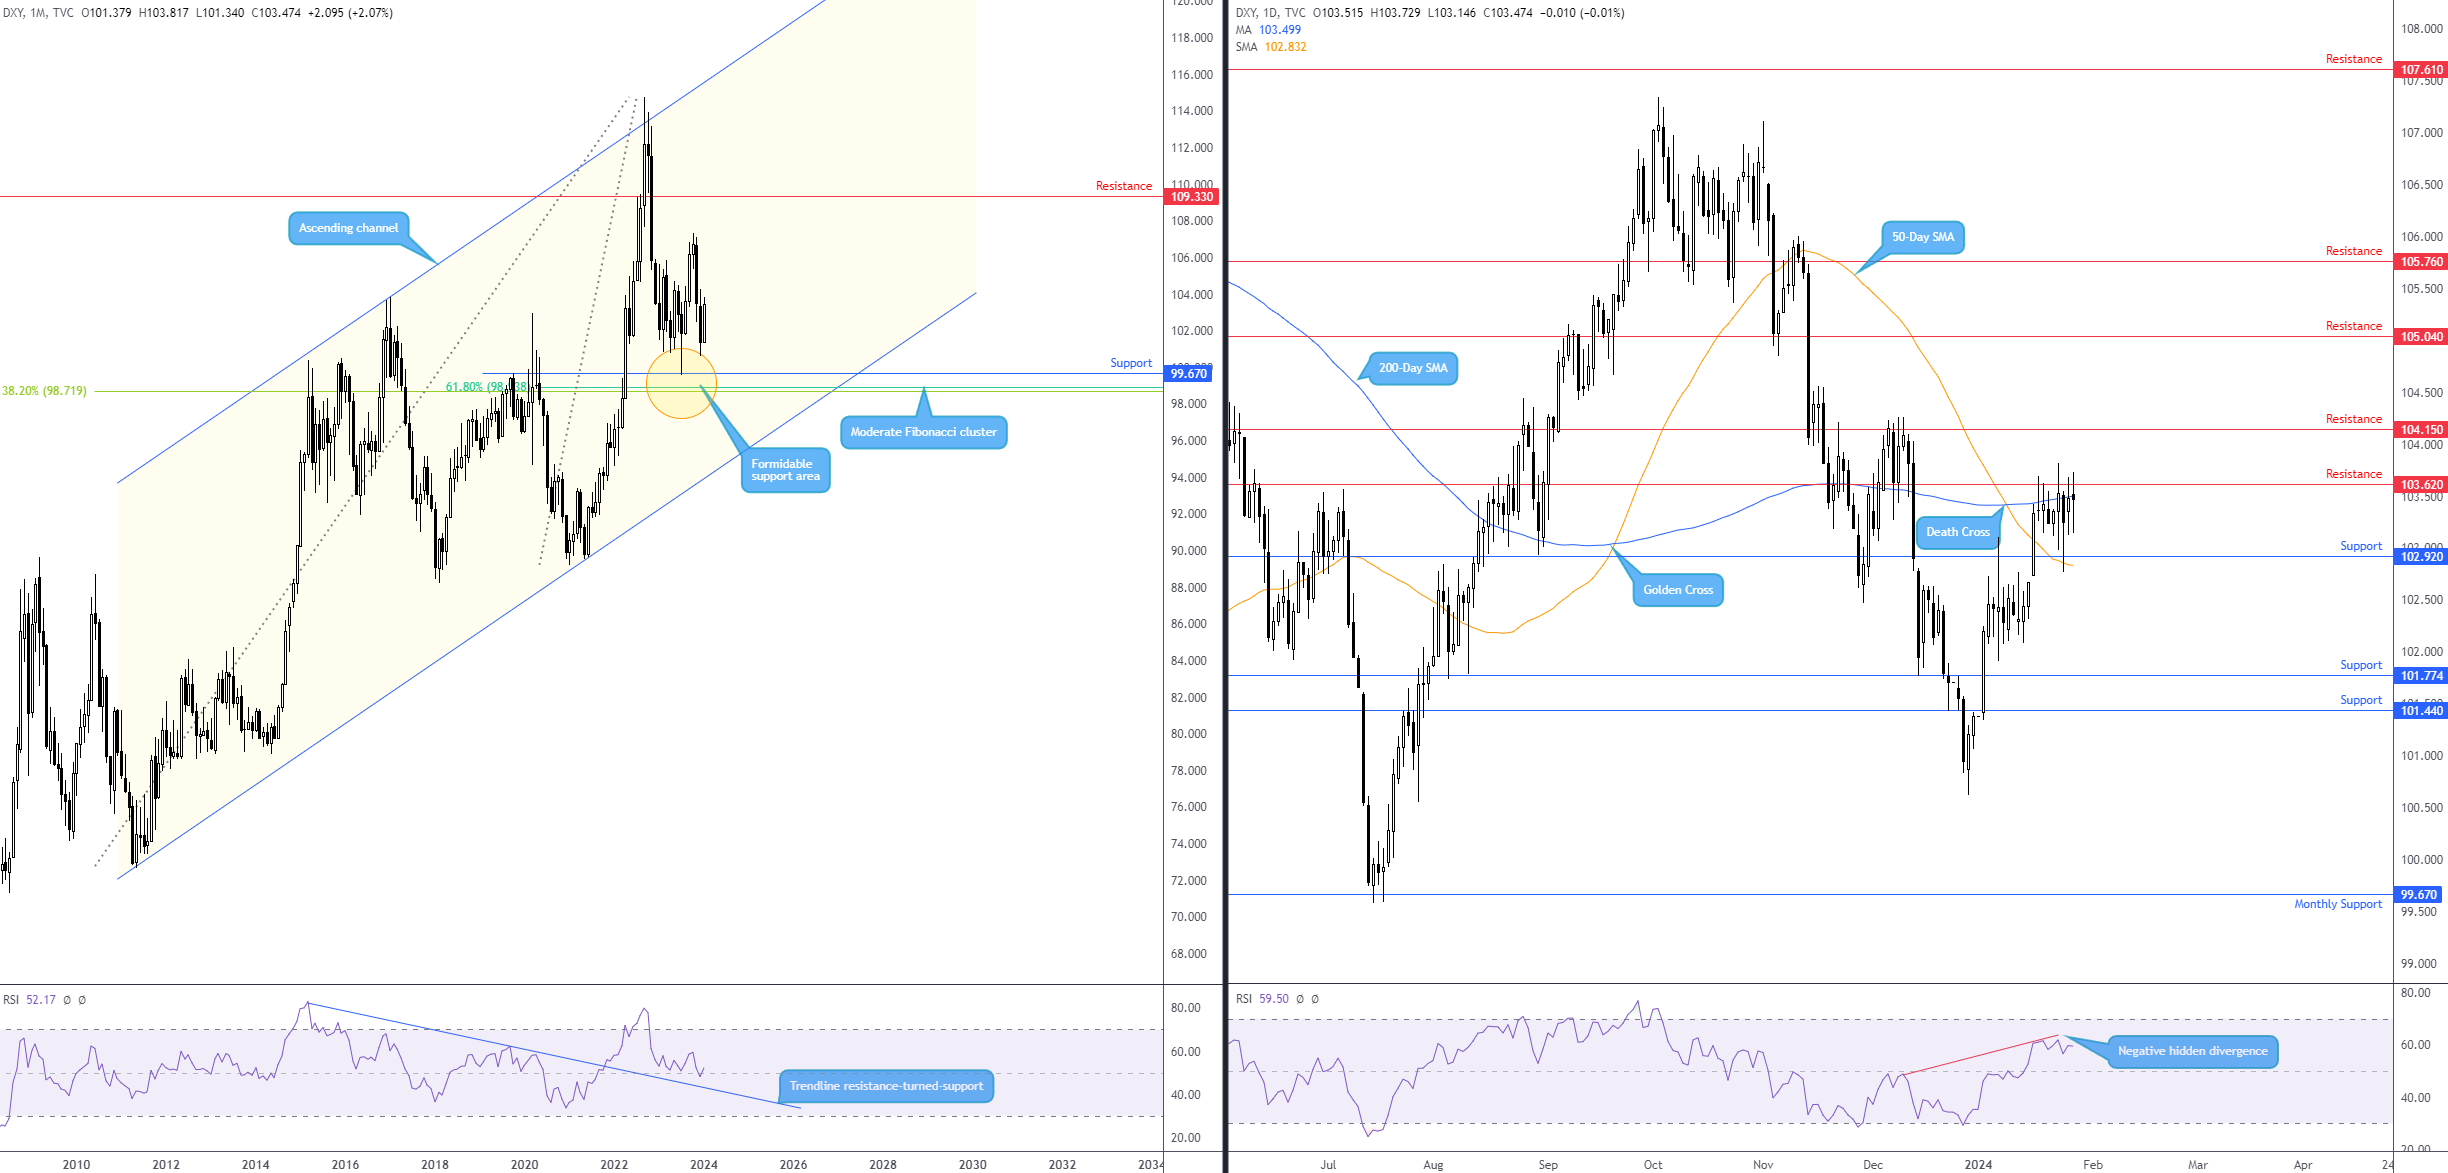
Monthly chart:
Technical observations on the monthly timeframe are largely unchanged from previous writing (and will likely remain so in Q1). You may recall from previous writing that the FP Markets Research Team aired the following:
Structures worth monitoring are support at 99.67 (backed up by a moderate Fibonacci cluster nearby at 98.72) and October’s (2023) peak at 107.35 as a possible resistance, with a breach here exposing another layer of resistance at 109.33.
It is important to underline that the monthly timeframe displays a clear view of the longer-term trend, which, despite lacklustre movement since early 2023, is north alongside momentum remaining just above positive (> 50.00), as per the Relative Strength Index (RSI).
Daily chart:
Resistance at 103.62 on the daily timeframe has seen its fair share of upside attempts in recent trading; this horizontal base shares space with the 200-day simple moving average (SMA) at 103.50. Equally interesting is support at 102.92 on the daily chart, a base that’s working closely with the 50-day SMA at 102.83 (note that this level boasts more of a significant history than the aforementioned resistance, delivering a support/resistance area since August 2023).
While price action recently signalled an early uptrend on the daily chart (higher low followed by a subsequent higher high), a Death Cross also formed at the beginning of the year (50-day SMA crossing below the 200-day SMA), signalling a longer-term downtrend, and the RSI pencilled in negative hidden divergence last week (usually indicates a continuation move to the downside and seldom forms in overbought regions). Venturing south of the 50.00 centreline would help confirm this signal.
Direction this week?
Supporting bulls, we have the long-term trend to the upside on the monthly scale, and the daily timeframe’s trend also shows signs of reversing north. In addition, the RSI indicator on the monthly timeframe is rebounding from its 50.00 centreline. This could support a move beyond the 200-day SMA/daily resistance (103.62) this week to aim for 104.15 resistance on the daily.
The evidence for dollar bears this week, on the other hand, consists of the scope to move lower on the monthly timeframe to support at 99.67, negative hidden divergence from the daily chart’s RSI, and the combination of daily resistance at 103.62 and the 200-day SMA.
Technically, the unit could venture either side of daily support and resistance (102.92 and 103.62, respectively) this week, opening the door to support at 101.77 or resistance at 104.15. Consequently, while some may opt to play the range, conservative traders are likely to wait until a defined breakout unfolds.
Source: TradingView
Author

Aaron Hill
FP Markets
After completing his Bachelor’s degree in English and Creative Writing in the UK, and subsequently spending a handful of years teaching English as a foreign language teacher around Asia, Aaron was introduced to financial trading,


