Powell comments still sink markets
USD: Dec '24 is Up at 106.675.
Energies: Dec '24 Crude is Up at 67.34.
Financials: The Dec '24 30 Year T-Bond is Down 23 ticks and trading at 115.19.
Indices: The Dec '24 S&P 500 emini ES contract is 18 ticks Higher and trading at 5901.00.
Gold: The Dec'24 Gold contract is trading Up at 2598.80.
Initial conclusion
This is not a correlated market. The USD is Up and Crude is Up which is not normal, but the 30 Year T-Bond is trading Lower. The Financials should always correlate with the US dollar such that if the dollar is Higher, then the bonds should follow and vice-versa. The S&P is Higher and Crude is trading Higher which is not correlated. Gold is trading Higher which is not correlated with the US dollar trading Up. I tend to believe that Gold has an inverse relationship with the US Dollar as when the US Dollar is down, Gold tends to rise in value and vice-versa. Think of it as a seesaw, when one is up the other should be down. I point this out to you to make you aware that when we don't have a correlated market, it means something is wrong. As traders you need to be aware of this and proceed with your eyes wide open. Asia traded Lower with the exception of the Hang Seng which traded Higher. All of Europe is trading Lower with the exception of the London exchange.
Possible challenges to traders
-
FOMC Member Goolsbee Speaks at 10 AM EST. This is Major.
-
NAHB Housing Market Index is out at 10 AM EST. This is Major.
-
TIC Long Term Purchases is out at 4 PM EST. This is Major.
Traders, please note that we've changed the Bond instrument from the 10 year (ZN) to the 2 year (ZT). They work exactly the same.
We've elected to switch gears a bit and show correlation between the 2-year Treasury notes (ZT) and the S&P futures contract. The YM contract is the Dow Jones Industrial Average, and the purpose is to show reverse correlation between the two instruments. Remember it's likened to a seesaw, when up goes up the other should go down and vice versa.
On Friday the ZT migrated Lower at around 8:30 AM EST with the Retail Sales numbers pending. The Dow migrated Higher at the same time. Look at the charts below and you'll see a pattern for both assets. The Dow moved Higher at 8:30 AM and the ZT moved Lower at around the same time. These charts represent the newest version of Bar Charts, and I've changed the timeframe to a 15-minute chart to display better. This represented a Short opportunity on the 2-year note, as a trader you could have netted about 50 ticks per contract on this trade. Each tick is worth $7.625. Please note: the front month for ZT is Dec and the Dow is now Dec '24. I've changed the format to filled Candlesticks (not hollow) such that it may be more apparent and visible.
Charts courtesy of Barcharts
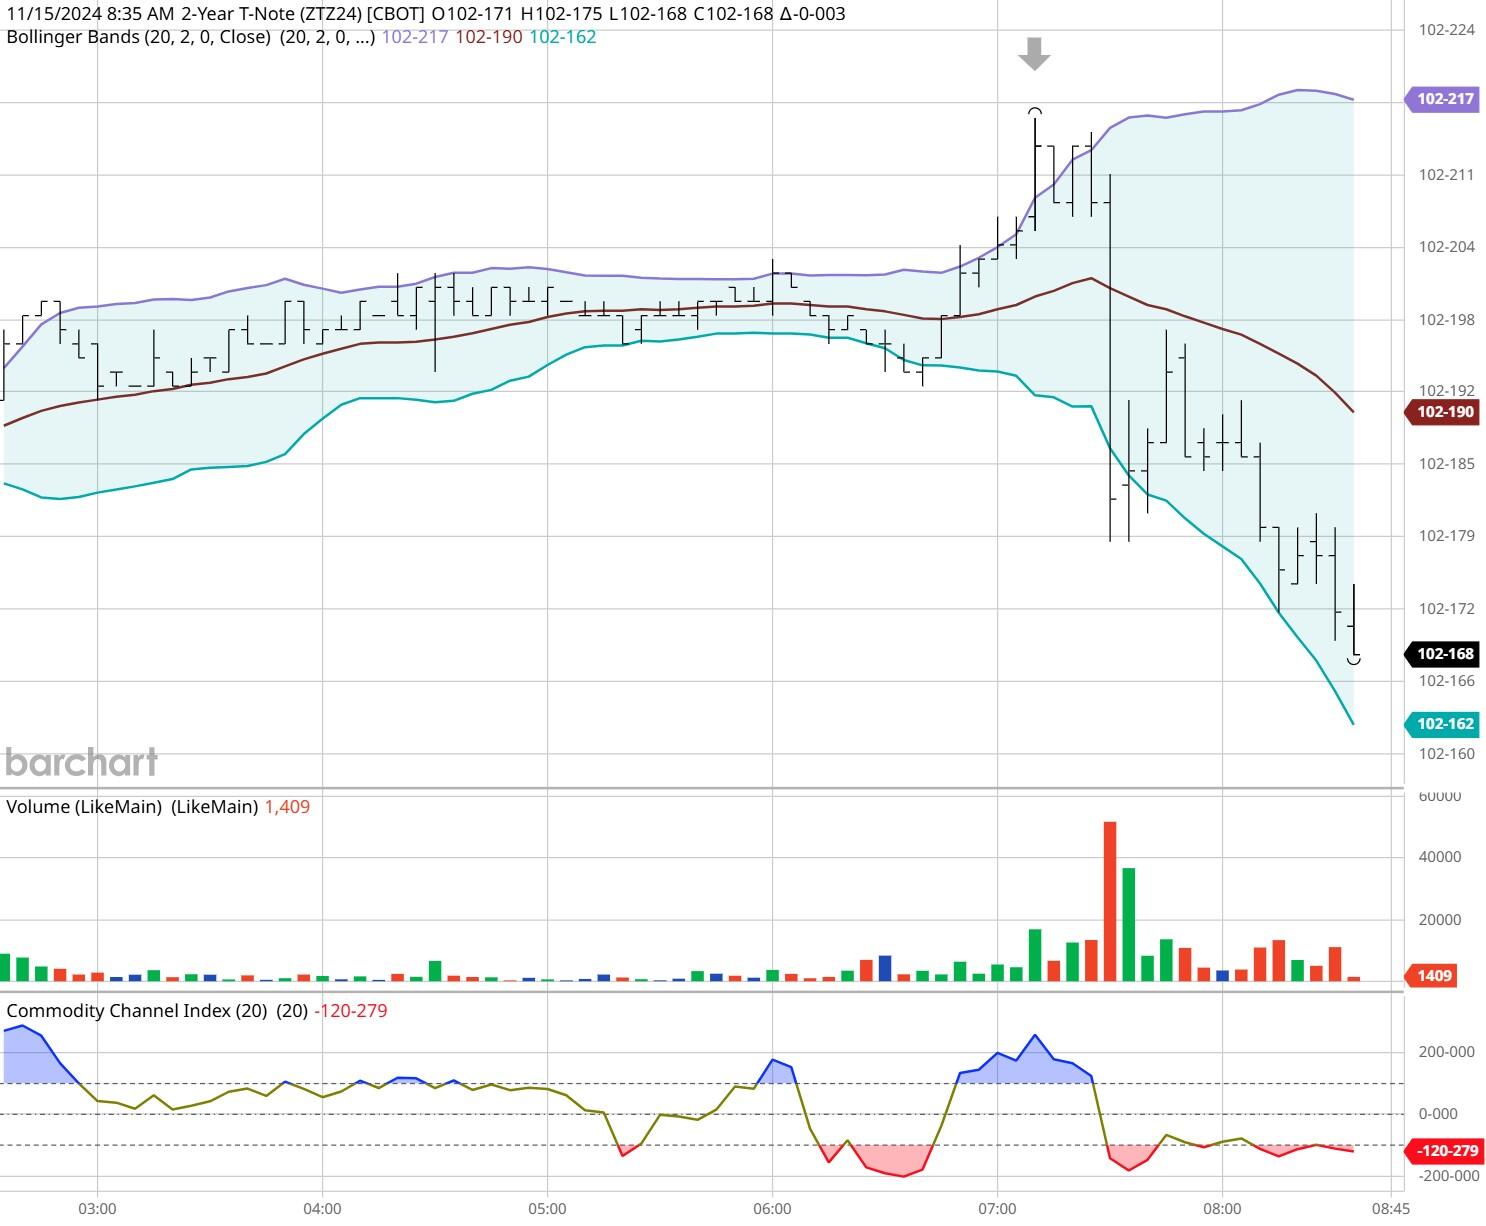
ZT -Dec 2024 - 11/15/24
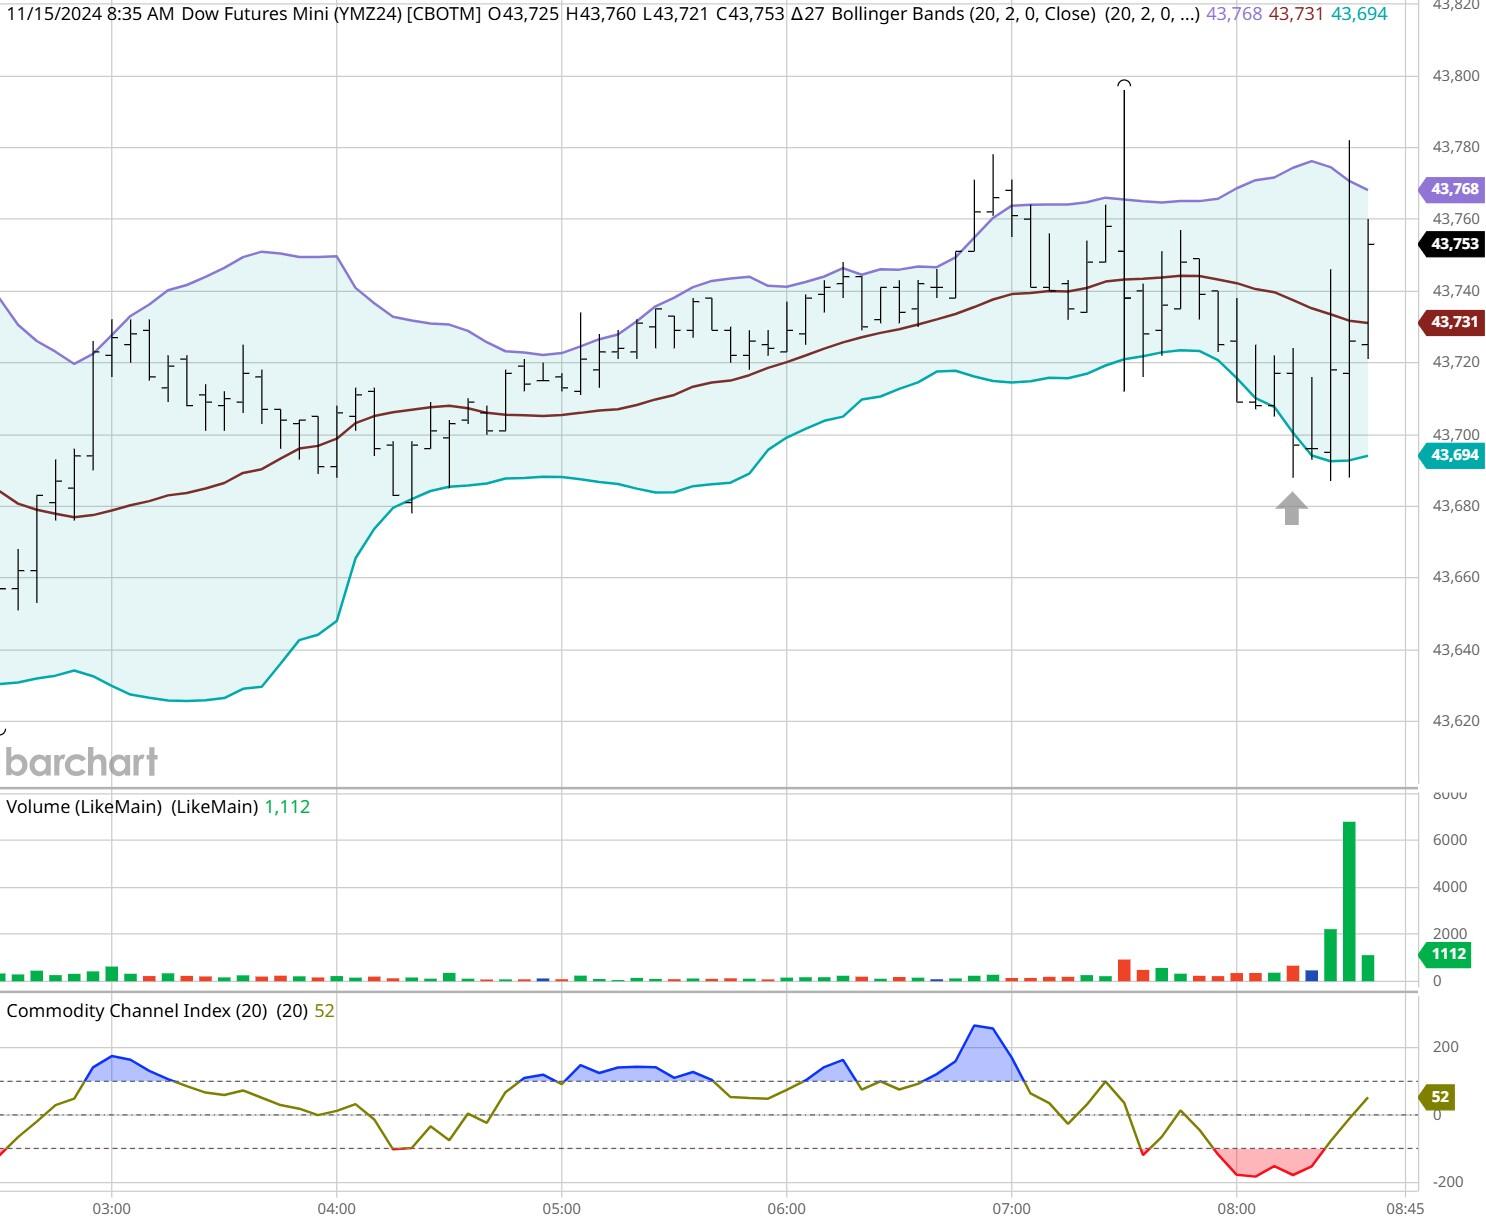
Dow - Dec 2024- 11/15/24
Bias
On Friday we gave the markets a Neutral or Mixed bias, but the markets had other ideas. The Dow closed Lower by 306 points and the other indices traded Lower as well. Today we aren't dealing with a correlated market and our bias will remain Neutral.
Could this change? Of Course. Remember anything can happen in a volatile market.
Commentary
Well it appears as though the Powell comments from Thursday transferred into Friday as the markets continued its downward slide. The markets and traders in general were expecting an interest rate reduction in December which would also coincide with the Holiday spending season, but Powell's comments suggest that this may not happen. As such the downward slide on Friday. Today we have the NAHB housing market index and FOMC Member Goolsbee speaking. I would pay attention to what Goolsbee has to say as he guided Obama during the financial meltdown of 2008.
Author

Nick Mastrandrea
Market Tea Leaves


