Patterns: USD/ZAR, ZAR/JPY
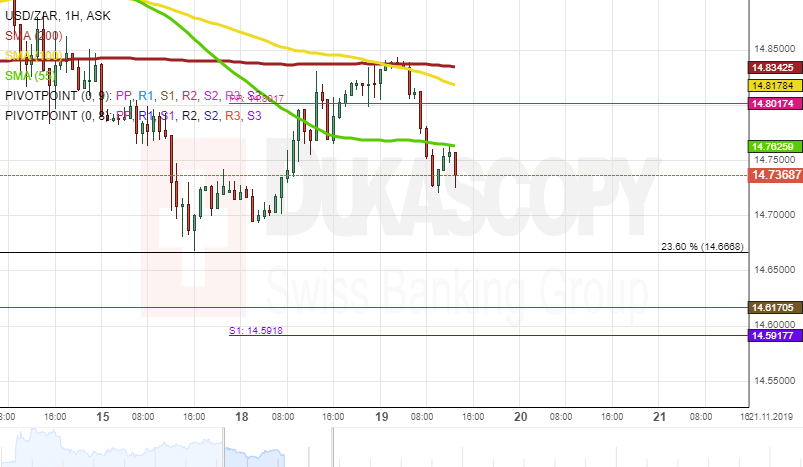
USD/ZAR 1H Chart: Falling wedge pattern in sight
The USD/ZAR currency pair reversed north from the lower boundary of the descending triangle pattern (4H time-frame chart) located at 14.52 at the end of October. Currently, the pair is trading at the 14.75 mark.
From a theoretical point of view, it is likely that some upside potential could prevail in the market, and the exchange rate could reach the upper pattern line located circa 15.25 in the nearest future. However, the expected advance might not be immediate, as the rate has to target the resistance level—the monthly PP at 15.00.
Also, note that the currency pair is pressured by the 55-, 100– and 200-hour moving averages. Thus, it is likely that the pair could re-test the lower pattern line in the short run. If the given pattern does not hold, it is likely the pair could target the Fibo 38.20% at 14.06.
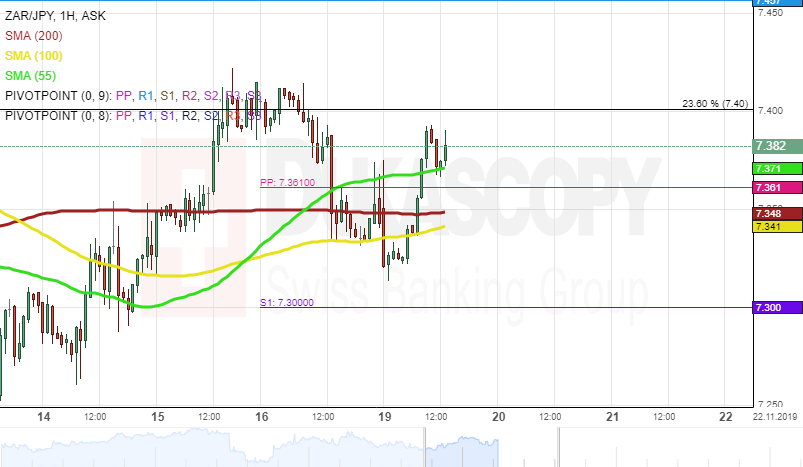
ZAR/JPY 1H Chart: Short-term increase expected
The ZAR/JPY exchange rate has been trading within the rising wedge pattern since the beginning of September. Currently, the rate is testing the resistance level formed by the Fibo 23.60% at 7.40.
Given that the currency pair is supported by the 55-, 100– and 200-hour SMAs, it is likely that bulls could prevail in the market, and the pair could reach the upper pattern line located 7.53 in the nearest future. However, the possible increase might not be immediate, as the pair has to surpass the resistance level formed by the monthly R1 at 7.48.
It is unlikely that the exchange rate could surpass the 7.55 mark due to the upper boundary of the long-term descending channel. Also, it is unlikely that bears could prevail, and the rate could drop lower than the psychological level at 7.00.
Author

Dukascopy Bank Team
Dukascopy Bank SA
Dukascopy Bank stands as an innovative Swiss online banking institution, with its headquarters situated in Geneva, Switzerland.


