Patterns: USD/NOK, EUR/NOK, BTC/USD, ETH/USD

USD/NOK 1H Chart: Bears likely to prevail
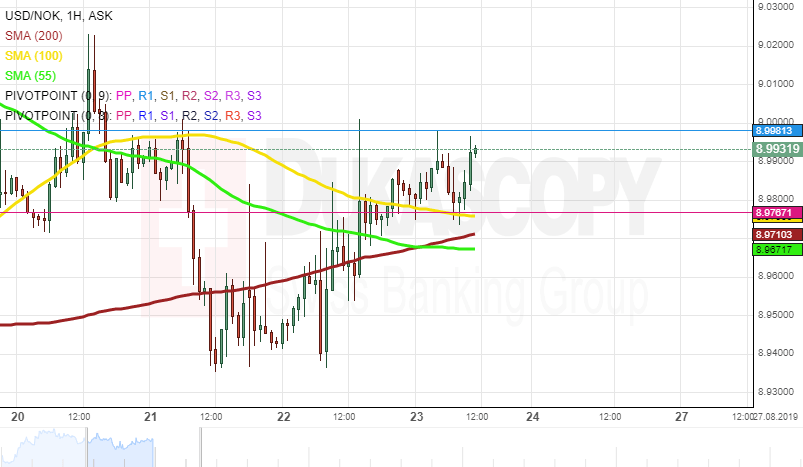
The US Dollar has been appreciating against the Norwegian Krone since the end of July when the USD/NOK exchange rate reversed north from the lower boundary of the long-term ascending channel at 8.5278.
As apparent on the chart, the currency pair has already reversed south from the upper channel line at 9.0450. from a theoretical perspective, it is likely, that some downside potential could prevail in the market, as the pair should target the lower channel line. Note, that the rate could be supported by the Fibonacci 23.60% retracement at 8.7106.
It is unlikely, that bulls could prevail in the market in the nearest future, and the US Dollar could exceed the monthly R2 at 9.1291 against the Norwegian Krone.
EUR/NOK 1H Chart: Short-term decline expected
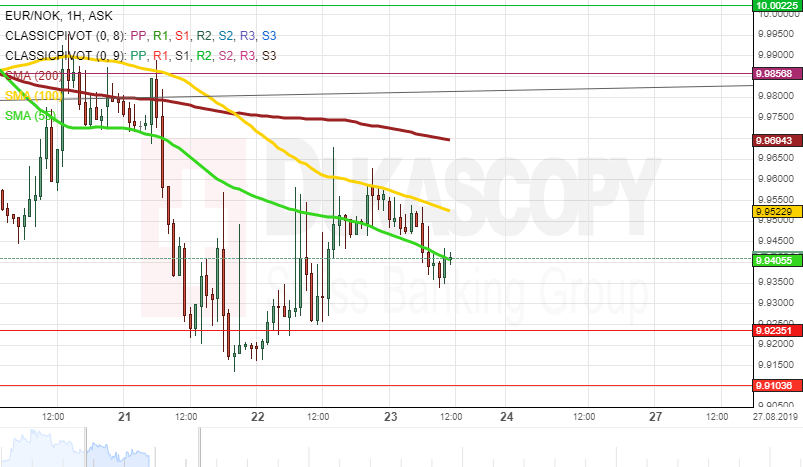
The EUR/NOK currency pair has been extending gains since the middle of July when it reversed north from the lower boundary of the rising wedge pattern at 9.60.
As apparent on the chart, the exchange rate has already reversed south from the upper pattern line at 10.08. From a theoretical point of view, it is likely, that the rate could continue to trade downwards in the short term, as it should target the lower wedge line. In this case, the pair could be supported by the Fibonacci 23.60% retracement at 9.78.
Also, note, that the rate is supported by the monthly R2 located at the 9.93 mark. Thus, a possible decline might not be immediate, and the pair could re-test the upper pattern line within the following trading session.
BTC/USD 4H Chart: Trades in triangle pattern
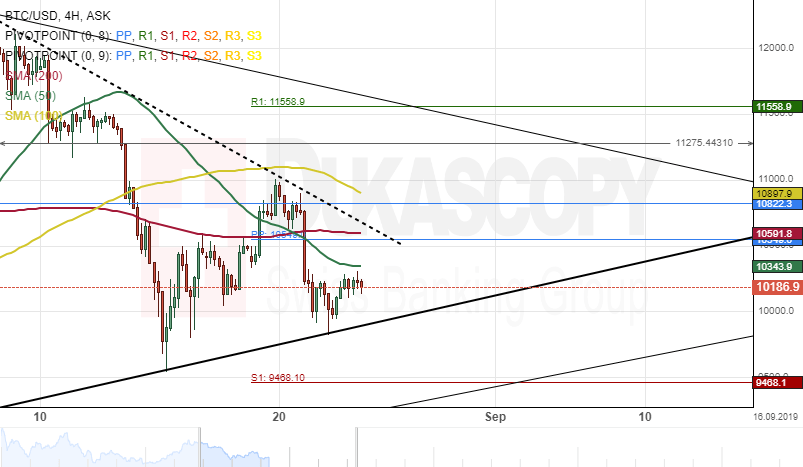
The BTC/USD exchange rate is currently trading in a triangle formation. The pair is trading near the bottom border of the pattern at 10178.8 and could be preparing for a breakout.
If this breakout occurs, bearish traders could drive the Bitcoin cryptocurrency towards a support cluster, formed by the weekly S2 and the monthly S1 at the 8500 area during the following trading sessions.
On the other hand, the pair might continue its gradual upside movement and potentially breach both the 50-, 100– and 200-period simple moving averages in the short term future.
ETH/USD 4H Chart: Sets for breakout
The ETH/USD pair has been trading south since the beginning of August when the exchange rate reversed from a resistance cluster formed by the weekly R2 and the monthly pivot point at 244.86. The pair has depreciated about 18.48% in value since August 6.
The Ethereum cryptocurrency is currently trading near the upper boundary of a descending channel at 195.46. If the resistance level, formed by the upper border of the descending channel holds, the pair will continue its southern movement in the short term future.
Everything being equal, Most likely, a breakout will occur during the following trading sessions.
Author

Dukascopy Bank Team
Dukascopy Bank SA
Dukascopy Bank stands as an innovative Swiss online banking institution, with its headquarters situated in Geneva, Switzerland.


