Patterns: USD/MXN XAG/USD AUD/CAD EUR/GBP

USD/MXN 1H Chart: Two scenarios likely
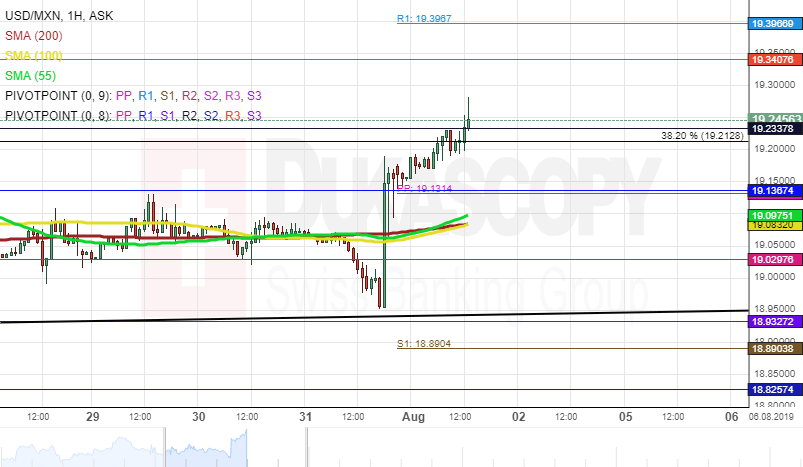
The USD/MXN currency pair has been trying to surpass the resistance level formed by the Fibonacci 38.20% retracement at 19.21 since the beginning of June.
Currently, the pair is testing the given resistance level. If it holds, it is expected, that a reversal south could occur in the nearest future. However, note, that the exchange rate could face the support of the lower boundary of the long-term ascending channel circa 18.95.
Note, that the rate is supported by the 55-, 100– and 200-hour SMAs, currently located at 19.10. Thus, the pair could surpass the given resistance and extend gains. Important resistance level to look out for is the weekly R2 at 19.32.
XAG/USD 1H Chart: Bears likely to prevail
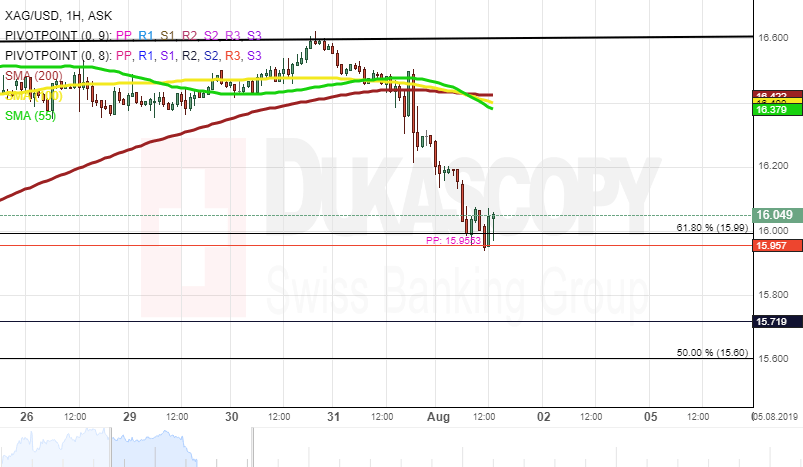
Last week, the XAG/USD exchange rate tried to breach the long-term ascending channel north. As apparent on the chart, the rate reversed south from the upper channel line at 16.60.
From a theoretical point of view, it is expected, that some downside potential could prevail in the market, as the rate should target the lower channel line located in the 14.50/15 range. Important support levels to look out for are Fibonacci 50.00% and 38.20% retracements, located at 15.60 and 15.21 respectively.
Note, that the rate is supported by the Fibonacci 61.80% retracement at 15.99. If the given support level holds, it is likely, that the rate could reverse north in the nearest future to re-test the upper channel line. It is unlikely, that a breakout north occurs due to the resistance of the 55-, 100– and 200-hour SMAs, located circa 16.40.
AUD/CAD 4H Chart: Guided by long-term descending channel
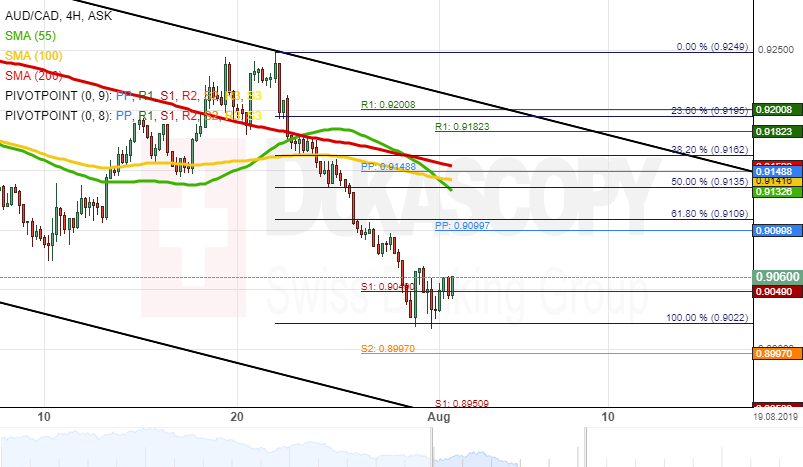
The Australian Dollar has been trading in a three-month descending channel pattern against the Canadian Dollar. The channel pattern was formed on April 16 and has been guiding the pair lower during the past three months.
Most likely, the AUD/CAD currency pair could continue its southern movement during the following trading sessions. The potential downward swing will be near the bottom border of the descending channel pattern at 0.8883.
However, the currency exchange rate might reverse north from a support level at 0.9022 and aim for a resistance cluster formed by the 55-, 100– and 200-hour SMAs at 0.9135 in the short-term future.
EUR/GBP 4H Chart: Moving towards 50.00% Fibo
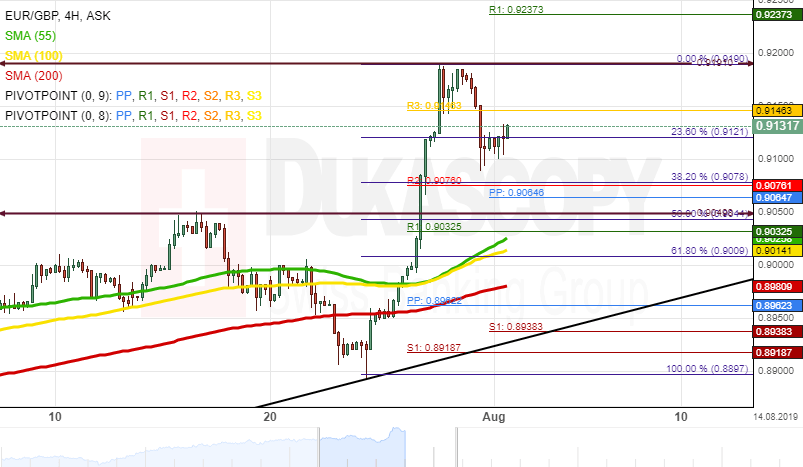
The common European currency has appreciated about 3.06% in value since July 25. The currency pair reached August 31, 2018, high level at 0.9191 during this week's trading sessions.
As for the near future, it is likely that the EUR/GBP exchange rate could aim for a support level formed by the 50.00% Fibonacci retracement level at 0.9044.
If the support level holds, the currency exchange rate will continue its bullish momentum in the long-term future.
However, if the pair passes the 50.00% Fibo level, a decline towards a support cluster formed by the 55– and 100-hour SMAs at 0.9011 in the short term.
Author

Dukascopy Bank Team
Dukascopy Bank SA
Dukascopy Bank stands as an innovative Swiss online banking institution, with its headquarters situated in Geneva, Switzerland.


