Overbought EUR/USD: Analysis of a bullish breakout driven by potential macro shifts

The analyst will conduct a comprehensive analysis of the EUR/USD currency pair from approximately June 2024 to April 2025, utilizing charts and the provided indicators alongside key macroeconomic factors and relevant numerical data, such as inflation rates, interest rate decisions, GDP growth figures, and unemployment rates from both the Eurozone and the United States.
Bollinger bands and z-score
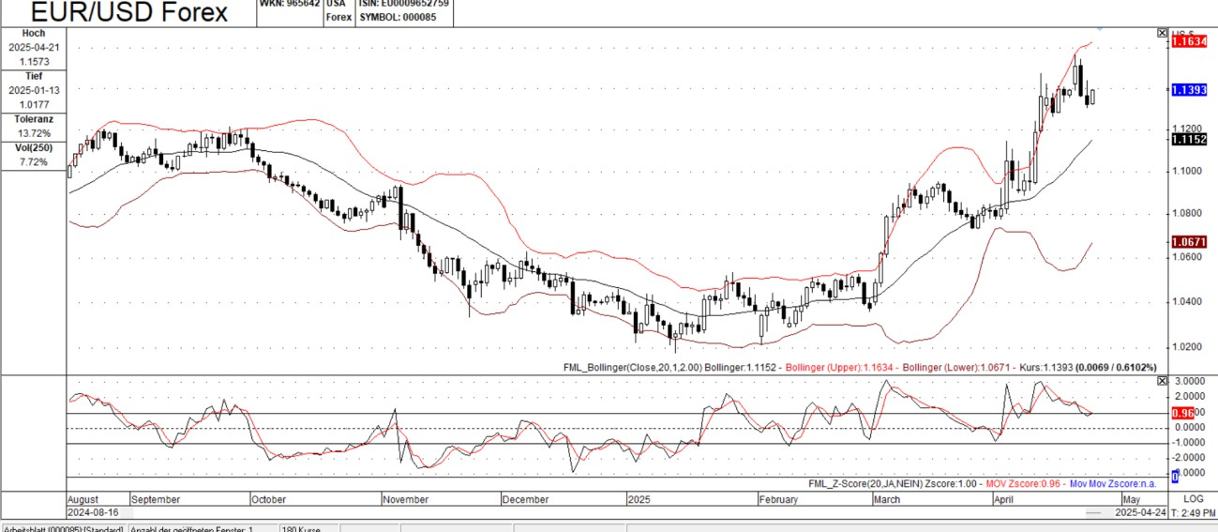
The Bollinger Bands consist of a middle band (typically a 20-period simple moving average), an upper band (2 standard deviations above the middle band), and a lower band (2 standard deviations below the middle band). Initially, from August to around December 2024, the price action shows a sideways to downward trend, with the price fluctuating between the upper and lower bands. From roughly February 2025 onwards, the price breaks above the middle band and then the upper band, indicating a strong bullish (upward) trend.
We see the bands widen significantly during the bullish breakout, confirming increasing volatility with the upward move. The price has repeatedly touched or slightly exceeded the upper band in the recent bullish surge.
The Z-Score mirrors the price action. It oscillates around the 0 line during the consolidation phase and then rises sharply into positive territory during the bullish trend, also suggesting overbought conditions in the recent period.
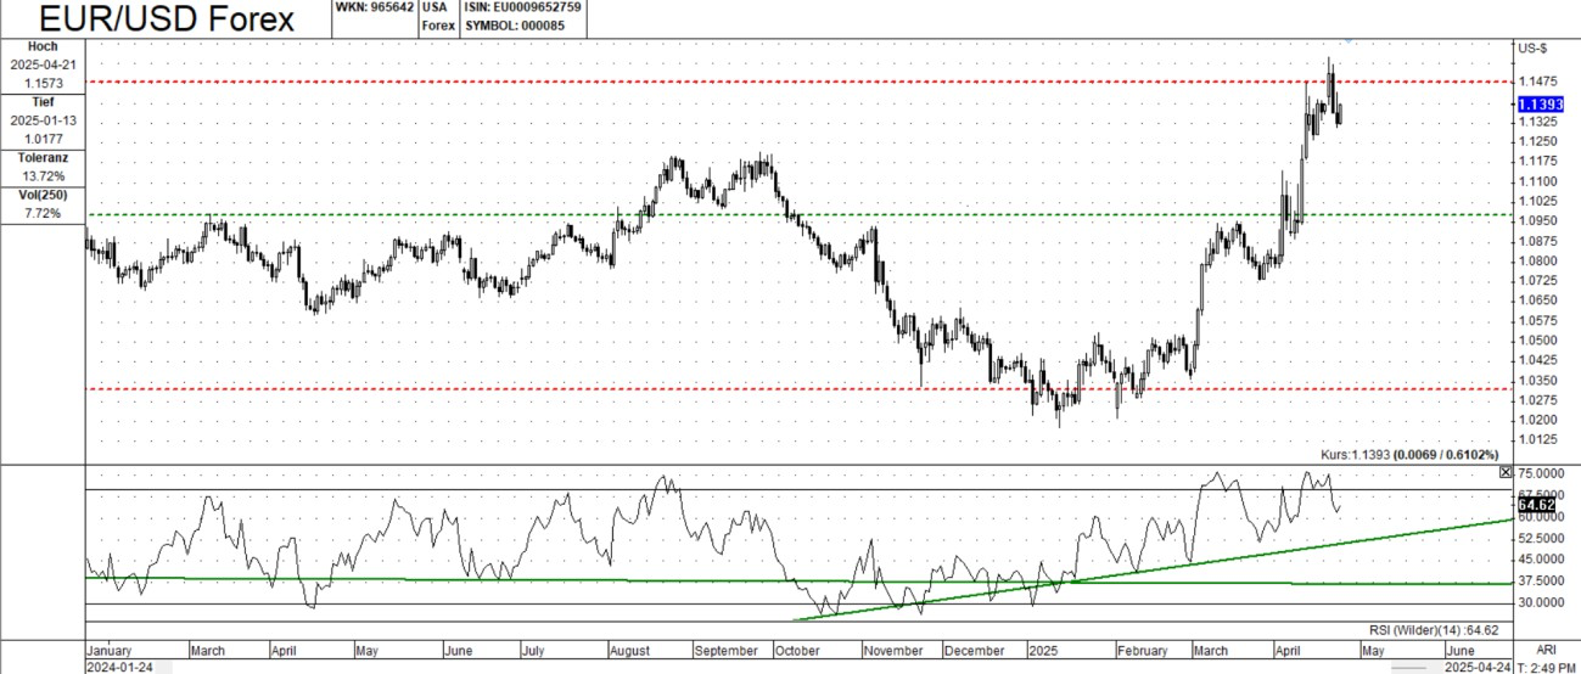
The RSI indicator shows a clear upward trend from late 2024, confirming the bullish momentum observed in the Bollinger Bands. The green line drawn on the RSI chart highlights this upward trend. The RSI is currently above 70, indicating overbought conditions, aligning with the overbought signals from the Bollinger Bands and Z-Score. There is no clear bearish divergence but the overbought reading warrants caution.
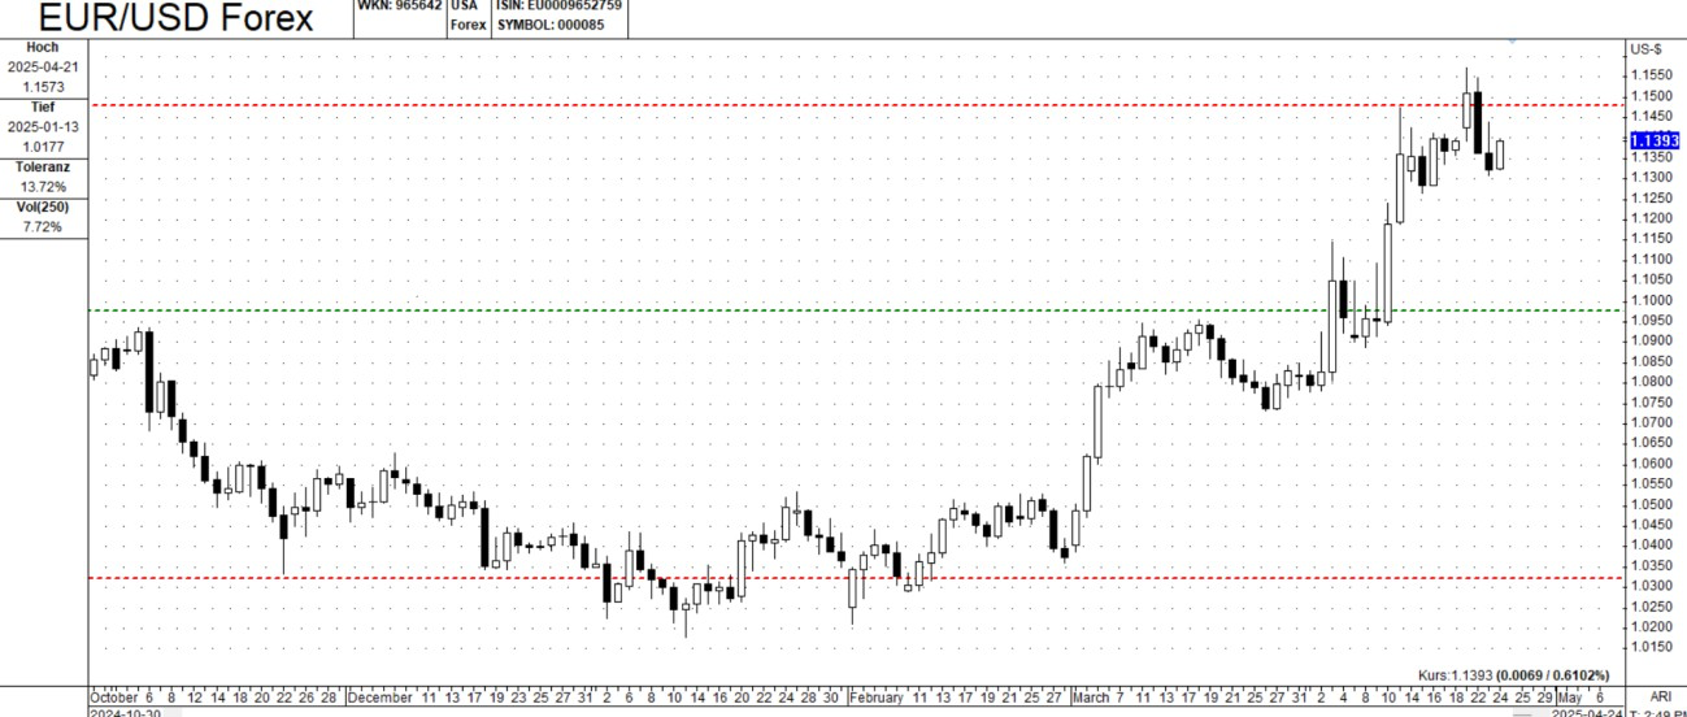
Support and resistance: Horizontal lines on the chart indicate potential support (price levels where the price tends to bounce up) and resistance (price levels where the price tends to meet resistance and reverse downwards) levels. The chart highlights significant resistance levels
above the current price and a support level below. The price has broken through previous resistance to reach its current level. The recent strong bullish move represents a breakout above a significant resistance level, which often signals a continuation of the upward trend. However, the overbought conditions suggest a potential pullback or consolidation.
Detailed analysis
The EUR/USD pair has transitioned from a period of consolidation/downtrend to a strong bullish uptrend starting around February 2025. The RSI and the bullish price action confirm strong upward momentum. Multiple indicators (Bollinger Bands, Z-Score, and RSI) suggest that the EUR/USD is currently in overbought territory, increasing the risk of a potential pullback or consolidation. The price has broken above key resistance levels, indicating bullish strength, but traders should be aware of potential support levels below in case of a retracement. Volatility has increased significantly with the bullish breakout, as shown by the widening Bollinger Bands.
The significant bullish breakout starting around February 2025, characterized by the price breaking above the middle and then the upper Bollinger Bands, accompanied by widening bands and a sharp rise in the Z-Score and RSI, suggests a shift in the fundamental landscape. Here's how macroeconomic factors could have played a role:
Interest rate differentials: Perhaps the ECB started to signal a more hawkish stance, or the Fed indicated a potential pause or slowdown in its rate hikes. A narrowing of the interest rate differential, or even expectations of the ECB catching up, could have made the euro more attractive.
Inflation rates: If Eurozone inflation started to show signs of being more persistent or higher than anticipated, while US inflation showed signs of cooling, this could have supported the euro.
GDP growth: An unexpected improvement in Eurozone economic data or a slowdown in US growth could have shifted investor sentiment in favor of the euro.
Unemployment rates: A significant drop in the Eurozone's unemployment rate or a rise in the US rate could have indicated relative economic strengthening in the Eurozone.
Trade balances: A notable improvement in the Eurozone's trade balance could have provided underlying support for the euro.
Government policies and stability: Any positive political or policy developments in the Eurozone, or negative ones in the US, could have influenced investor confidence.
The widening Bollinger Bands during this breakout confirm increased volatility as the market reacted to potentially significant macroeconomic news or shifts in expectations. The RSI consistently trending upwards and entering overbought territory reinforces the strong bullish momentum driven by these underlying factors. The breakout above previous resistance levels further suggests that the macroeconomic narrative had shifted enough to overcome prior selling pressure.
Trading implications
Potential pullback: Given the overbought conditions, traders should be cautious about chasing the uptrend at these levels. The overall trend is bullish, so buying opportunities on dips (pullbacks) could be considered. Proper risk management is crucial. Continue to monitor the price action and indicators for signs of trend reversal, such as bearish divergences, breakdown of support levels, or a return of the RSI to neutral territory.
Author

FxPro Traders Research Team
FxPro Traders
The FxPro Traders Research Team delivers advanced analysis and strategies designed to empower your success in today's dynamic forex markets.


