Only be a contrarian at extremes: Technical analysis – DAX 40, GBP/USD, NZD/JPY

What does it mean to be contrarian?
It definitely doesn’t mean just to buy when everyone else is selling, and to sell when everyone else is buying - because that simply doesn’t work. That is like standing in front of a steamroller.
Being a contrarian is recognising the rare times in the market environment when ‘everybody’ is making the same trade and assuming it will keep working. The basic premise is that if everybody is already buying, there’s nobody left to buy more - so the price has to drop to find buyers - which self-evidently means it’s better at that time to be a seller.
Of course, picking at those particular times when it makes sense to go against the crowd is not easy. Again, that's why I usually always use the crowd to my advantage during trends.
Being contrarian does also tend to involve trying to ‘pick the top’ or ‘catch the bottom’ of a market - which is notoriously difficult. Most of the time the trend keeps going. It only tops or bottoms once.
So, is it even worth trying to be a contrarian? Well there’s no need to answer that categorically - you need to decide in EVERY trade you place, whether you are trend-following or ‘contrarian’ counter-trend trading - is the risk: reward ratio worth it?
Usually, the potential reward for picking the top or bottom is very high. The closer your entry is to that top or bottom defines how big your risk is.
There are sentiment tools to help find these extremes, which can be worth looking at - such as the weekly COT Report. But my team and I focus on the price.
Markets are naturally ‘mean-reverting’. That means when they get too extreme, they go back to their ‘average’ price. How far the price has moved away from its moving average is a good proxy for this idea.
We think Germany’s DAX 40 index (traded as D40/EUR on the WeTrade platform) has gotten very far away from its moving average.
So in summary we are looking to go short the DAX.
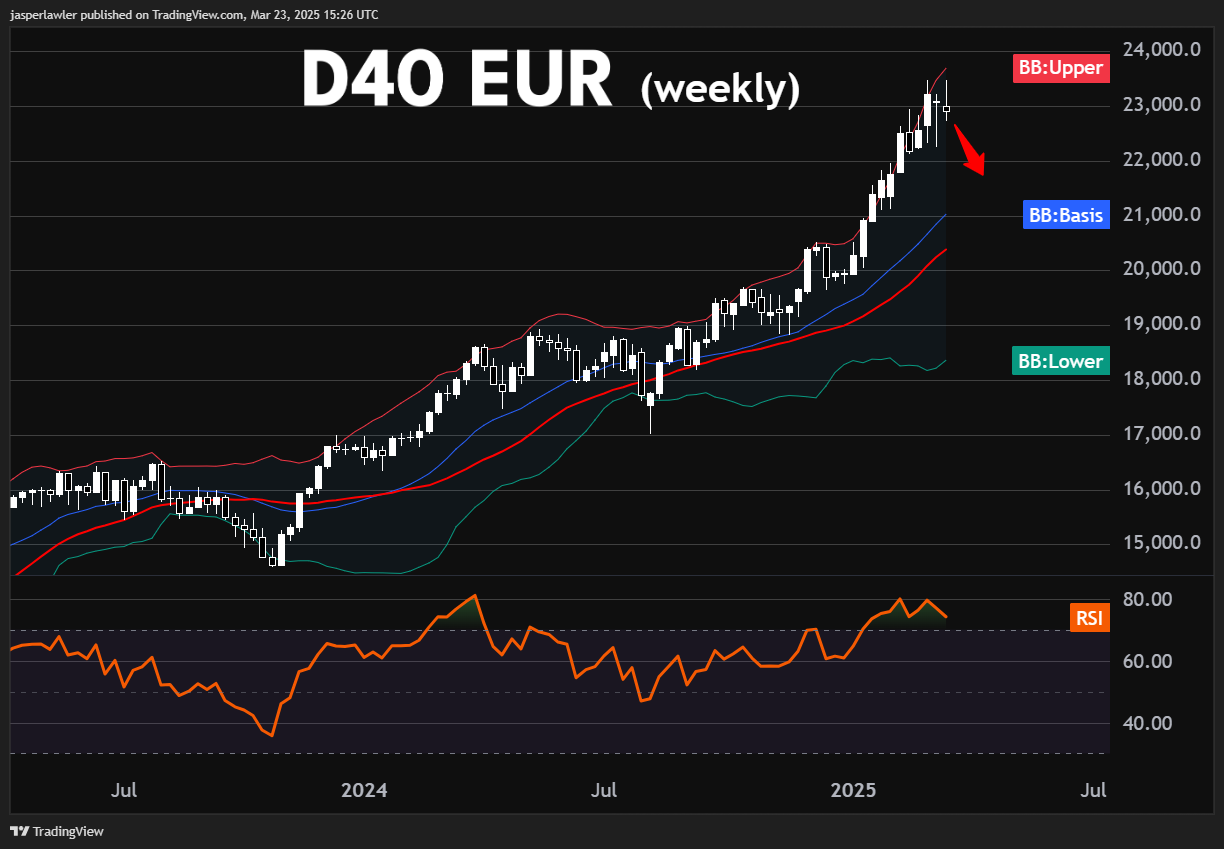
DAX 40 (D40/EUR)
Long-term chart (weekly)
Trend: Up.
Phase: Overbought.
Resistance = 21,000 (20-week MA).
Support = 23,500 (record high).
Price action: The DAX.
-
Last touched its 30 week moving average on the week of September 9 over 6 months ago.
-
From August 5 to March 3, it rose from 17,000 to 23,500. A rise of 38% in 7 months.
-
Was hugging its upper Bollinger band (2 standard deviations) for 8 weeks in a row.
-
RSI has made a double top pattern at the 80 overbought level.
View: We are ready to get bearish during a correction from overbought levels.
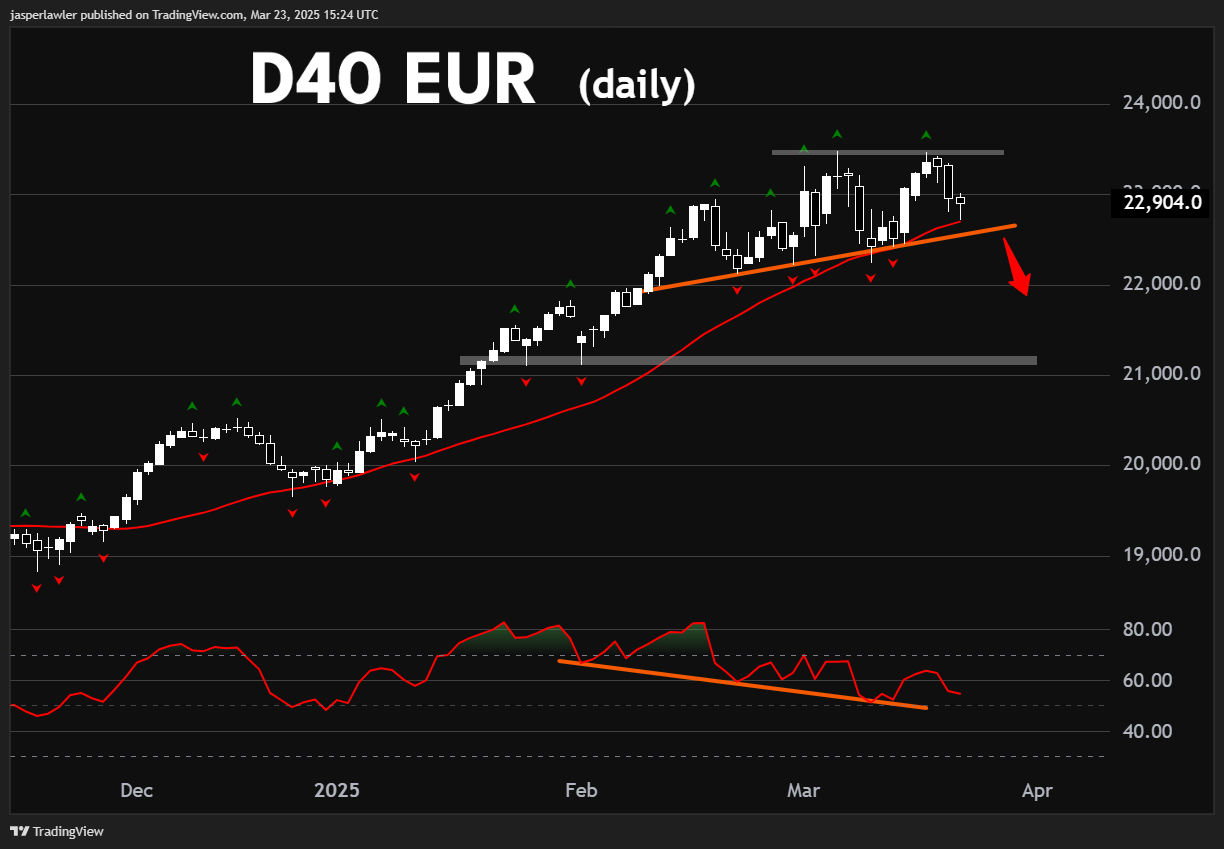
Medium-term chart (daily)
Trend: Up.
Phase: consolidation.
Resistance = 23,500 (record high).
Support = 22,500 (rising trendline).
Price action: The momentum has already evidently slowed on the daily chart with RSI making lower highs and lows, while the price consolidates in a triangle pattern. A break below the triangle is our cue that the market is beginning a larger pullback.
NOTE: Should the price make a false break lower, whether price drops under the rising trendline but quickly pops back above it - either in the same day or the next day - the short trade has failed and it will be a strong signal to trade with the trend for another leg higher.
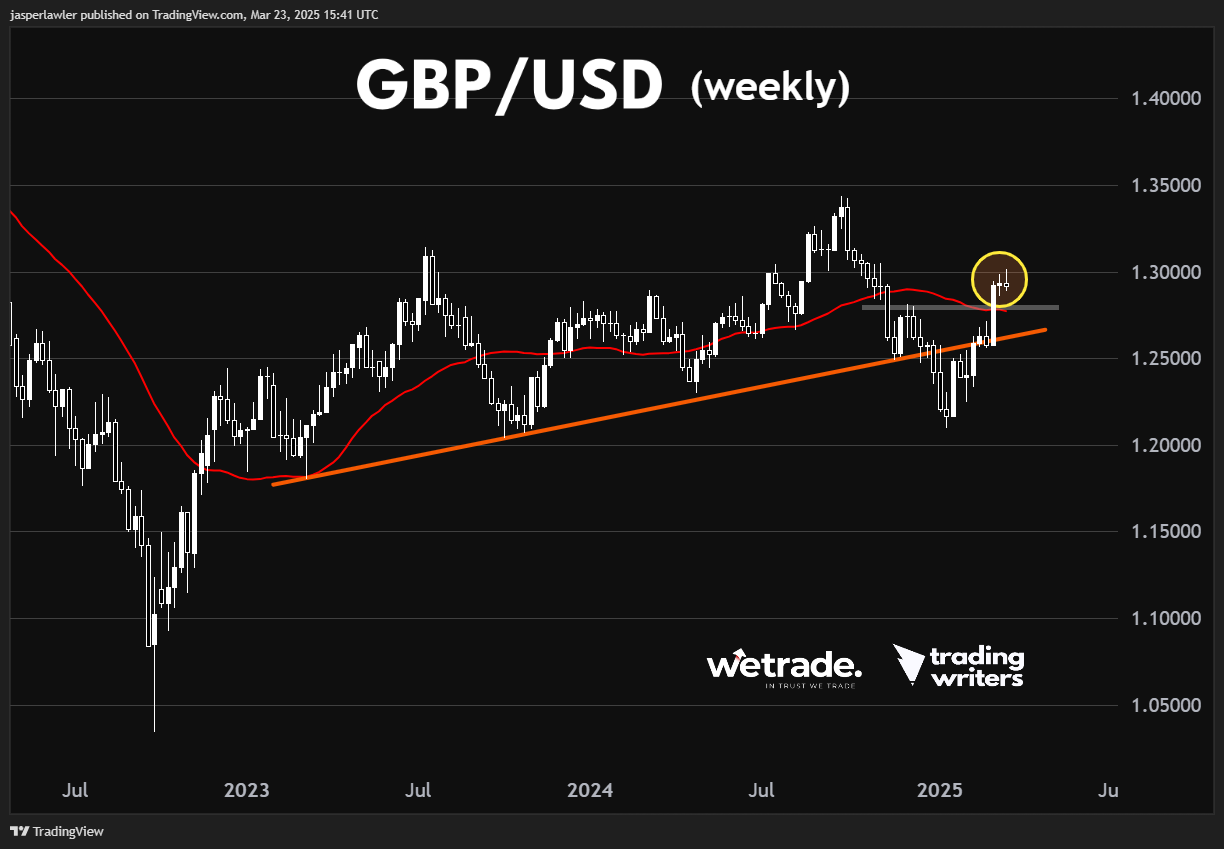
GBP/USD
Long-term chart (weekly)
Trend: Up.
Phase: Nearing end of first leg up.
Resistance = 1.30.
Support = 1.27 (trendline).
Price action: Last week the price finished with a 2nd weekly ‘spinning top’ indecision candle at the 1.30 round number. We expect a pullback from this area to offer new opportunities in a few days to back long into the new uptrend at lower prices.
View: Bullish while above the (twice broken) rising trendline.
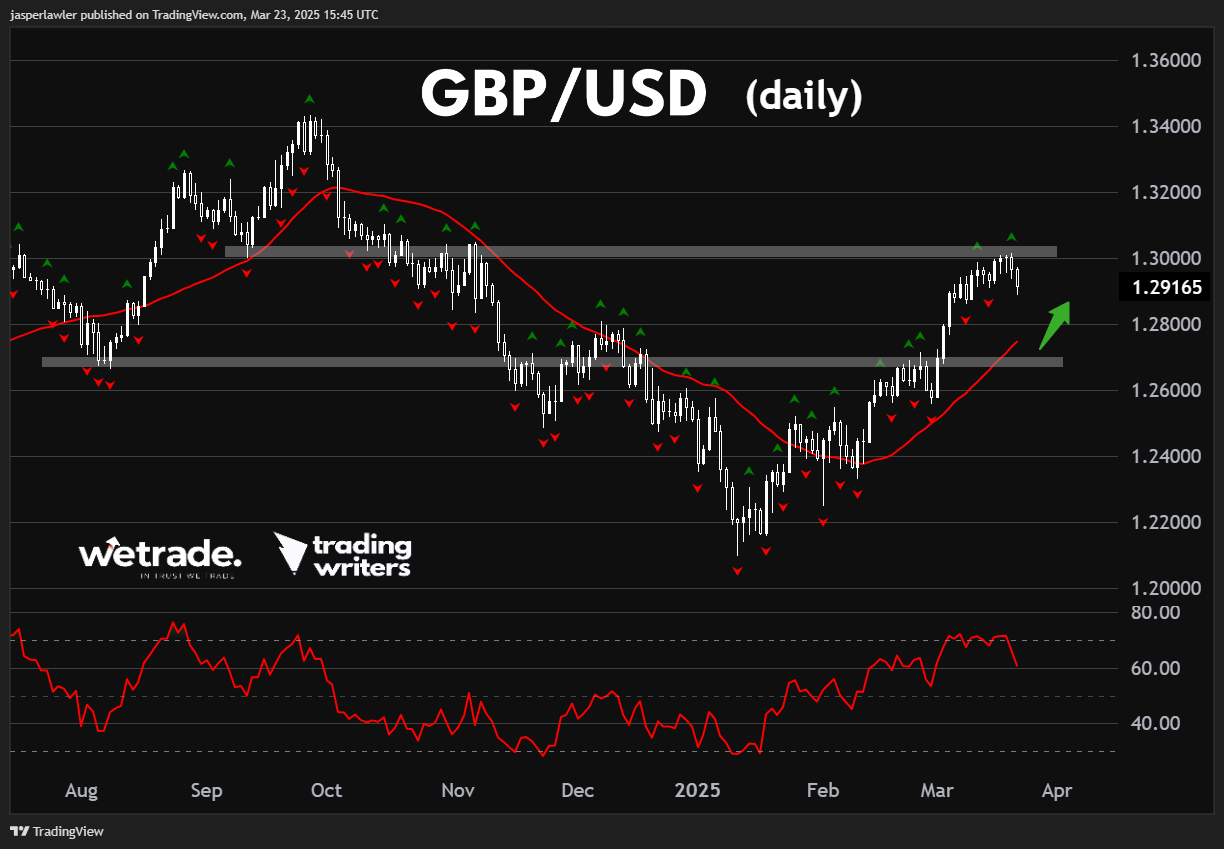
Medium-term chart (daily)
Trend: Up.
Phase: possible pullback from overbought.
Resistance = 1.30.
Support = 1.27.
Price action: Price looks over-extended after an 800-pip rally from the 2025 low, potentially setting up a new long entry as price moves back to its 30-day moving average as well as the broken resistance at 1.27.
NZD/JPY
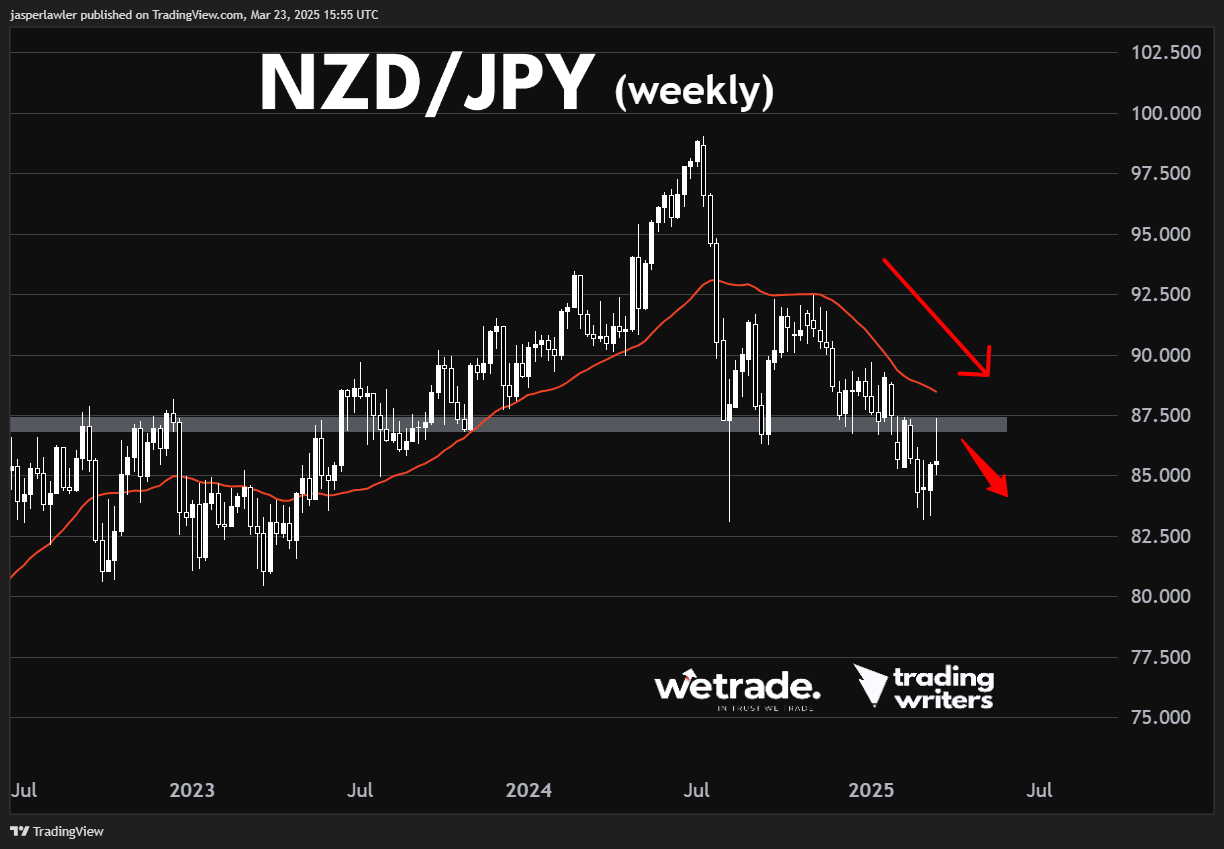
Long-term chart (monthly)
Trend: Down.
Phase: Short pullback.
Resistance = 87.50.
Support = 83.
Price action: The price has successfully re-tested and dropped back away from the broken support we referenced in the analysis of Week 5. The long-wicked shooting star reversal candle adds to the bearish implications. The main risk to getting short here is that a double bottom has formed at 83.
View: Bearish while below 87.50
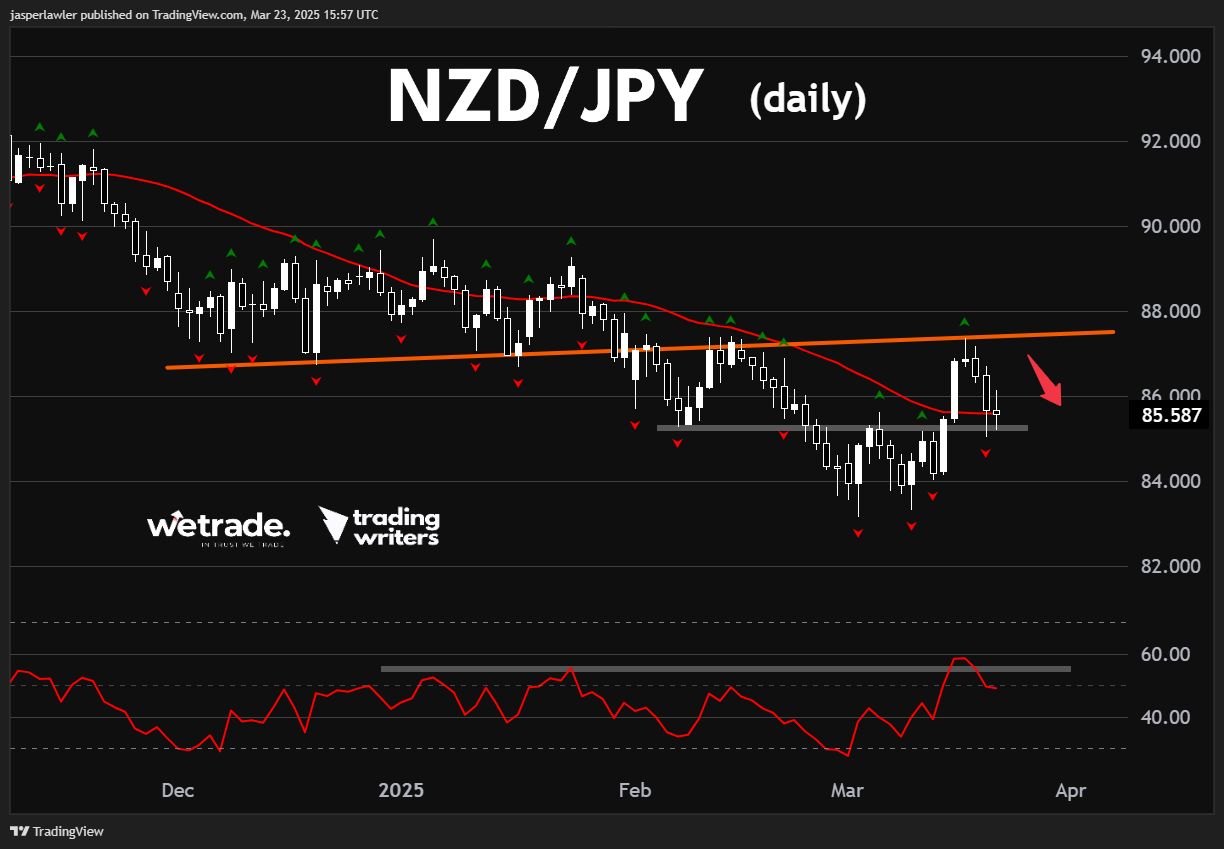
Medium-term chart (daily)
Trend: Down.
Phase: Possible bounce coming.
Resistance = 20,500.
Support = 19,000.
Price action: We would expect some rebound back over 86 but will look to fade any bounce towards the re-tested rising trendline with an expectation that the price takes out the lows at 83. A break over the rising (orange) trendline means the trade is a bust.
In collaboration with WeTradeBroker
Author

Jasper Lawler
Trading Writers
With 18 years of trading experience, Jasper began his career as a stockbroker on Wall Street in New York City before sharpening his analytical skills at top trading firms in the City of London.


