Oil prices gain on OPEC+ supply cuts extension

Oil prices have climbed above the $86 mark. This increase comes as OPEC+ extended its oil supply curbs until year-end, signalling continued efforts to stabilise the market.
The Dollar index has surged to its highest level since March, while the Dow Jones index closed lower for the third consecutive session. Several Federal Reserve governors have expressed support for raising interest rates ahead of the Fed's meeting on September 19th, contributing to a more hawkish stance that has boosted the dollar. This has, in turn, put pressure on gold prices despite the dollar's strength. In contrast, oil prices have climbed above the $86 mark. This increase comes as the world's largest oil cartel, OPEC+, extended its oil supply curbs until year-end, signalling continued efforts to stabilise the market. Elsewhere, the Australian dollar has gained some respite from its recent sluggish trend. Australia's GDP data came in slightly better than market consensus, although it has declined from its previous reading.
Market movements
Dollar index
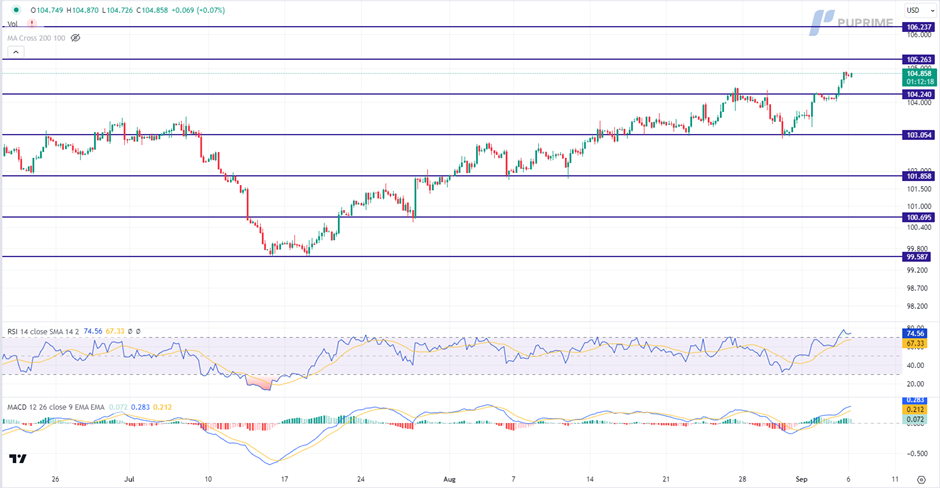
The US dollar continues to maintain its bullish trajectory, capitalising on the rising US Treasury yields and the underlying economic resilience within the United States. Market participants are closely monitoring the anticipation of a potentially more hawkish tone from the Federal Reserve in its forthcoming statement, further amplifying the greenback's allure as a safe-haven asset amidst global economic uncertainties.
The dollar index extended its gains following the prior breakout above the previous resistance level. However, MACD has illustrated diminishing bullish momentum, while RSI is at 62, suggesting the index might be traded lower as technical correction since the RSI retreated from the overbought territory.
Resistance level: 105.25, 106.25.
Support level: 104.25, 103.05.
XAU/USD
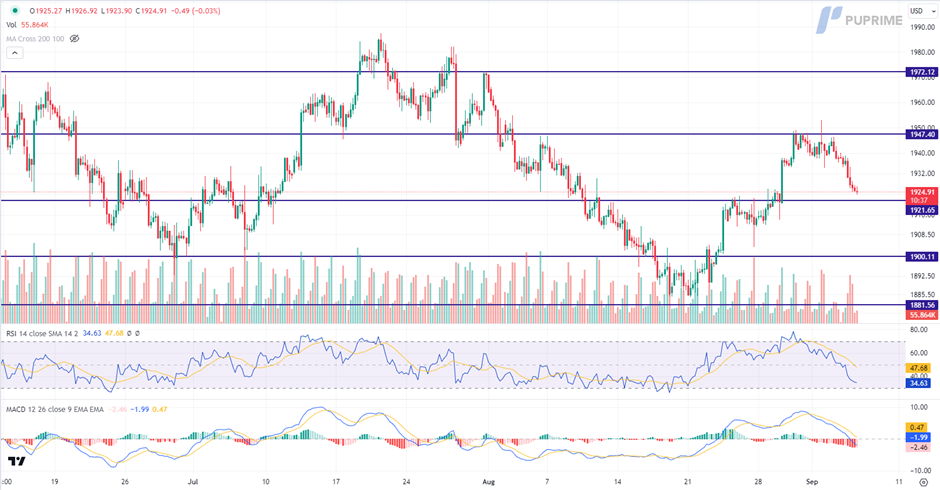
Gold prices faced a sharp decline, echoing the ascent of US Treasury yields and the resolute US dollar. The dollar, in its persistent bullish trajectory, has been bolstered by the surging US Treasury yields and the underlying robustness of the US economy.
Gold prices are trading lower following the prior retracement from the resistance level. MACD has illustrated increasing bearish momentum, while RSI is at 35, suggesting the commodity might extend its losses toward support level.
Resistance level: 1945.00, 1970.00.
Support level: 1920.00, 1900.00.
EUR/USD
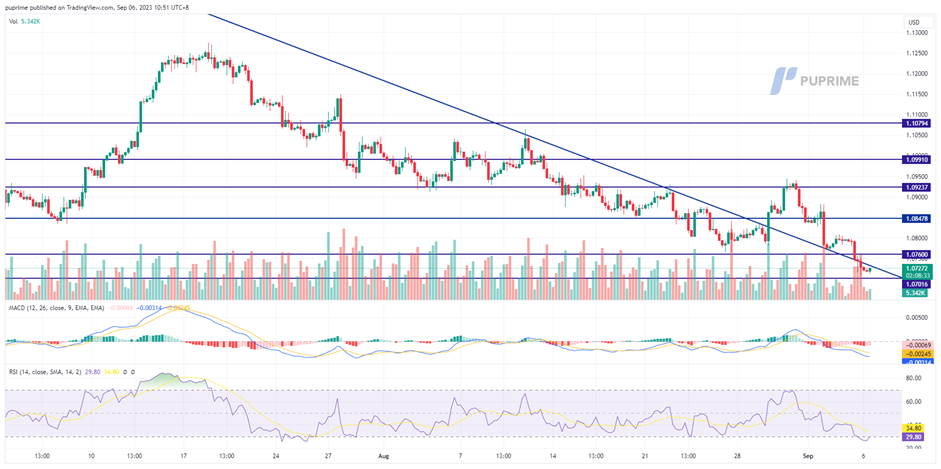
The euro's decline persisted as the dollar gained more strength, driven by hawkish comments from Federal Reserve officials. Fed governors, including Christopher Waller and Cleveland Fed President Loretta Mester, are pushing for additional interest rate hikes, reflecting the view that the U.S. economy can withstand higher rates. The struggling euro is now eagerly awaiting the eurozone's GDP data, set to be released on Thursday, hoping it may serve as a catalyst for a potential rebound.
The EUR/USD continues to trade lower and is approaching another support level at 1.0700. The RSI has entered into the oversold territory while the MACD continues to slide, suggesting the pair is trading in a strong bearish momentum.
Resistance level: 1.0760,1.0850.
Support level: 1.0700, 1.0640.
AUD/USD
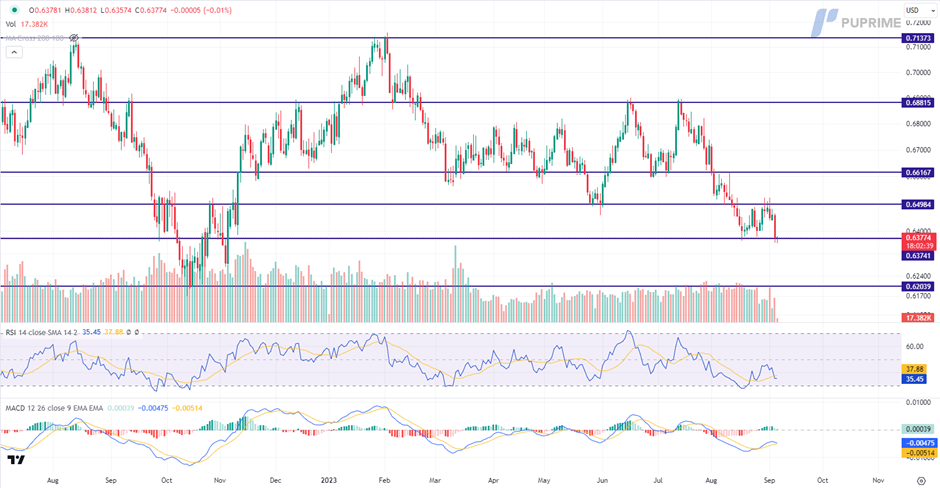
The Reserve Bank of Australia (RBA) has opted to keep interest rates steady for a third consecutive month during its September policy meeting. The RBA has maintained its benchmark interest rate at 4.10%. This decision is rooted in the belief that recent economic data align with the central bank's goal of steering inflation back within the target range of 2-3%. Consequently, the Australian dollar experienced a measured retreat following this announcement.
AUD/USD is trading lower while currently testing the support level. MACD has illustrated diminishing bullish momentum, while RSI is at 35, suggesting the pair might extend its losses after breakout below the support level.
Resistance level: 0.6500, 0.6615.
Support level: 0.6375, 0.6205.
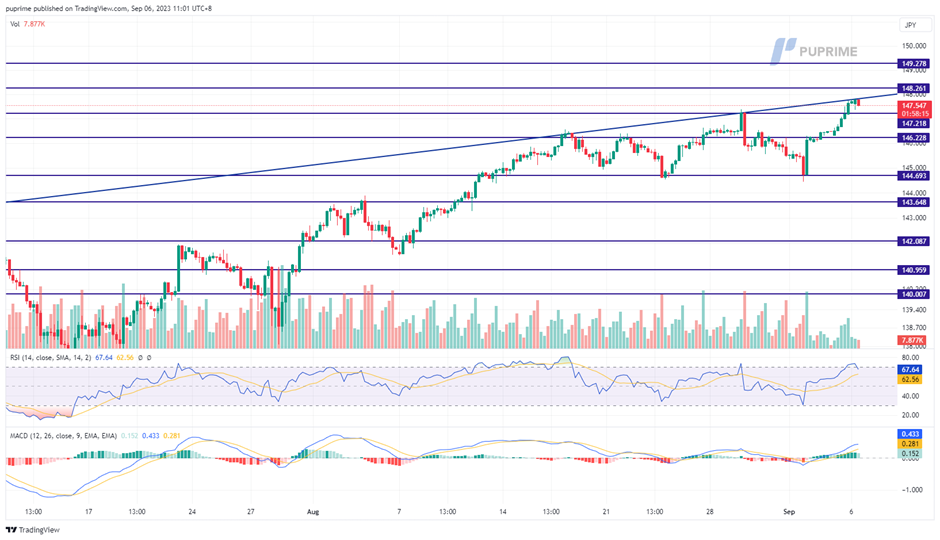
USD/JPY
The Japanese yen is losing ground and is currently trading at its weakest level against the USD since last November. This decline is primarily attributed to the strengthening of the dollar, driven by hawkish statements from Federal Reserve officials in anticipation of their meeting on September 19th. The USD/JPY pair has reached its highest level in 2023. This situation has raised concerns among investors, given that Japanese authorities have previously intervened in the foreign exchange market to stabilise their currency's strength. Market participants are now closely monitoring whether Japanese authorities might take similar actions once again.
USD/JPY is trading higher and is about to break above its long-term uptrend resistance level. The RSI has broken into the overbought zone, while the MACD moving upward above the zero line suggests the bullish momentum is strong.
Resistance level: 148.25, 149.26.
Support level: 147.20, 146.20.
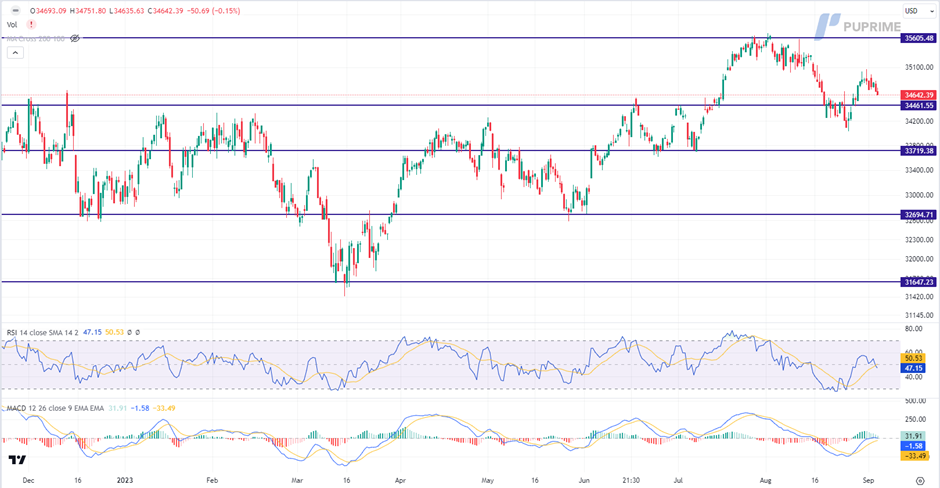
Dow jones
The Dow edged lower ahead of monetary statements from several Federal Reserve this week. Higher US Treasury yields put downward pressure on the intrinsic value of companies, impacting the US equity market. Investors eagerly await Federal Reserve signals for insights into future interest rate decisions.
The Dow is trading lower while currently testing the support level. MACD has illustrated diminishing bullish momentum, while RSI is at 47, suggesting the index might extend its losses after breakout.
Resistance level: 36580.00, 35605.00.
Support level: 34460.00, 33720.00.
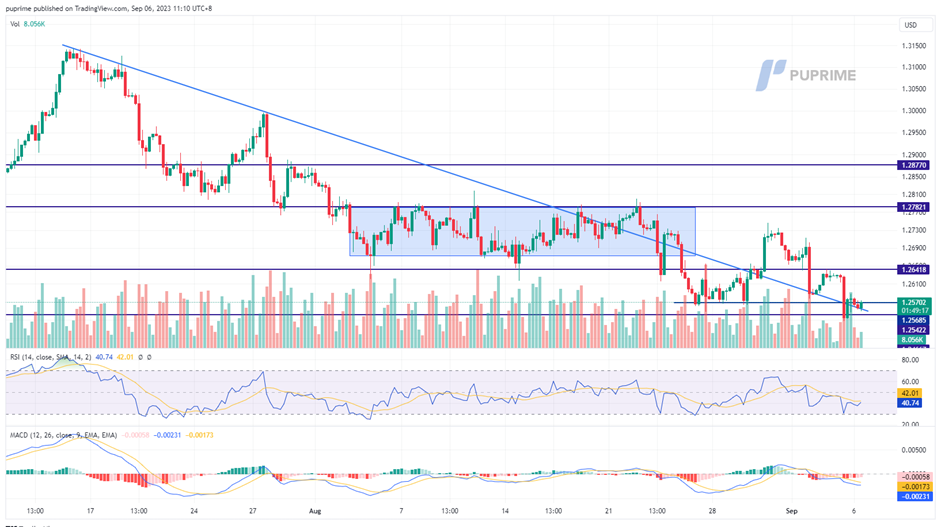
GBP/USD
The British pound (GBP) has displayed a bearish trend against the US dollar (USD), forming a pattern of lower high prices for the GBP/USD currency pair. This trend has been driven by the ongoing strengthening of the US dollar, which is gaining momentum ahead of the Federal Reserve's upcoming interest rate decision scheduled for September 20th. Furthermore, the lacklustre economic performance of the United Kingdom has prevented the pound from staging a significant rebound. Adding to the negative sentiment, the city of Birmingham, the second-largest city in the UK, recently declared itself bankrupt due to financial challenges faced by the city council. This development has further weighed on the value of the British pound.
The Sterling has formed a downtrend price pattern with a triple lower high. The RSI is approaching the oversold zone while the MACD continues declining, suggesting the bearish momentum has persisted.
Resistance level: 1.2650, 1.2780.
Support level: 1.2570, 1.2460.
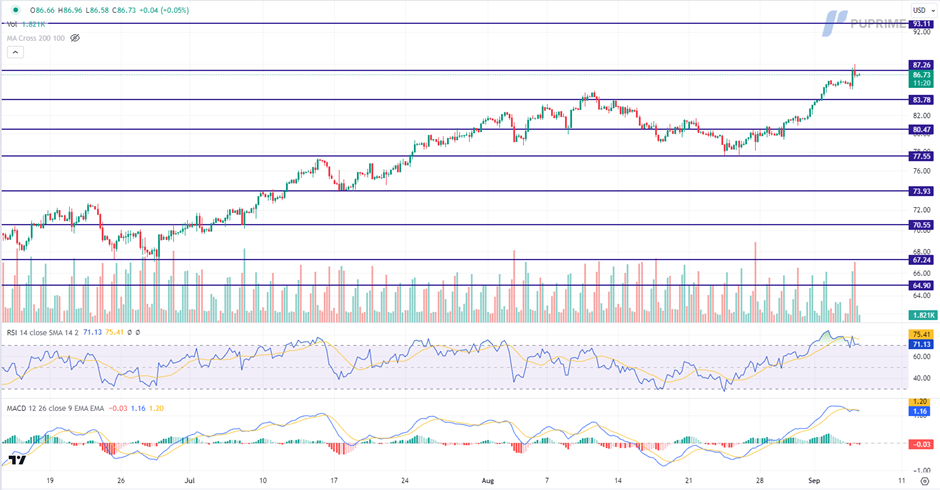
CL Oil
Oil prices continue their ascent in Asian trade, firmly maintaining a trajectory towards 10-month highs. This bullish trend in oil prices is primarily attributed to larger-than-anticipated supply cuts enacted by oil giants Saudi Arabia and Russia. These strategic moves have signalled an impending tightening of supplies within the global oil market. Investors' optimism in the oil sector is sustained by the extended agreement to cut oil production by an additional 1 million barrels per day until the end of December. Furthermore, Russia has reiterated its commitment to maintaining export curbs of 300,000 barrels per day until the close of the year.
Oil prices are trading higher while currently testing the resistance level. However, MACD has illustrated increasing bearish momentum, while RSI is at 71, suggesting the commodity might enter overbought territory.
Resistance level: 87.25, 93.10.
Support level: 83.80, 80.45.
Author

PU Prime team
PU Prime
PU Prime is an award-winning CFD broker offering clients access to multiple products across multiple asset classes. Traders will have access to FX, Commodities, Indices, Share CFDs and Bonds.


