Oil prices decline on OPEC+ meeting result

Despite OPEC+ announces production cuts, oil traders remained unconvinced, leading to a nearly 3% plunge in oil prices overnight. The efficacy of these cuts is questionable as they are implemented on a "voluntary" basis. Notably, Angola rejected the measure, expressing dissatisfaction with its allocated output quota. Simultaneously, the US dollar's strength faces challenges, particularly following the release of US PCE data, which revealed signs of easing inflation. This diminishes the likelihood of further rate hikes by the Federal Reserve. In contrast, US equity markets experienced a robust performance in the best month of 2023. The Dow Jones, in particular, led the charts, reaching its highest level since January 2022.
Market movements
Dollar Index
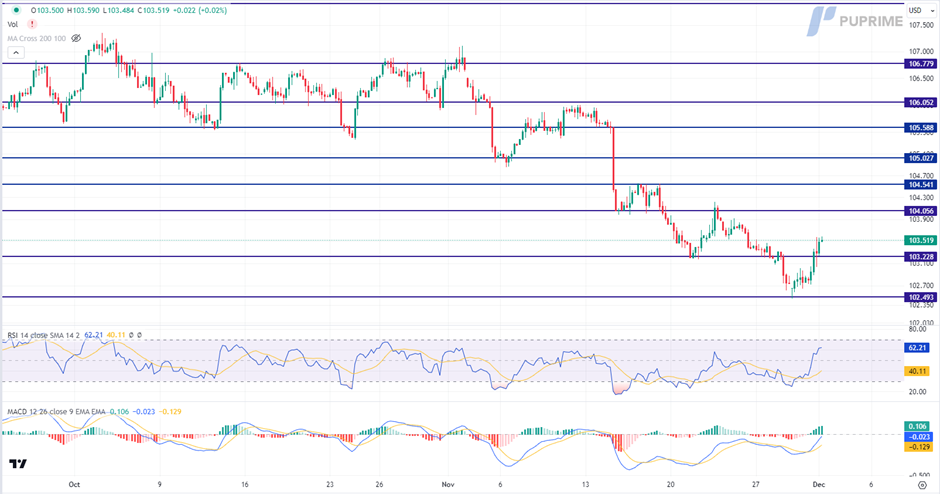
The US Dollar stages a comeback as investors engage in bargain buying following inflation data that aligned expectations. Meanwhile, better-than-expected US Initial Jobless Claims further contribute to the Dollar's resurgence, reflecting a solid labour market and boosting confidence in the greenback.
The Dollar Index is trading higher following the prior breakout above the resistance level. MACD has illustrated increasing bullish momentum, while RSI is at 62, suggesting the index might extend its gains since the RSI stays above the midline.
Resistance level: 104.05, 104.55.
Support level: 103.25, 102.50.
XAU/USD
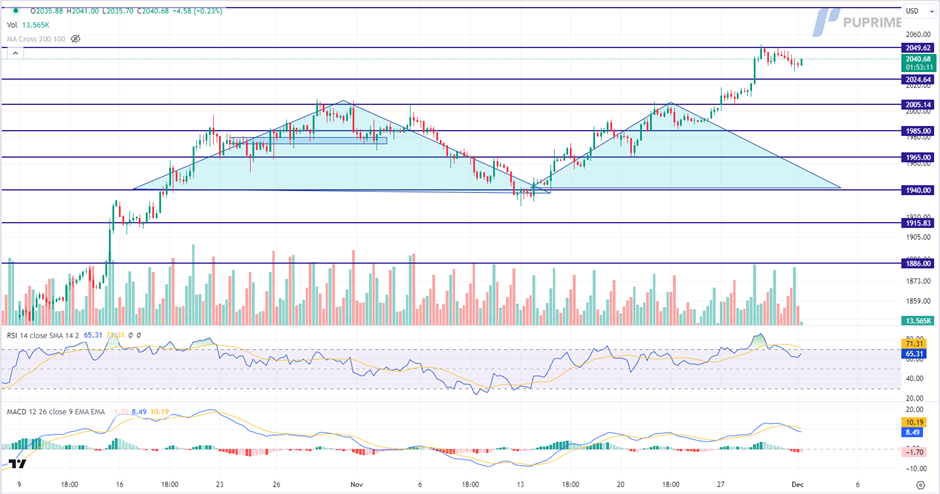
Gold prices experience a slight retreat from the critical resistance level of $2050 as profit-taking ensues and the rebound in the US Dollar exerts pressure on the dollar-denominated precious metal. Despite this short-term dip, the overall outlook for gold remains bullish, driven by the potential pause in the Federal Reserve's tightening cycle, which could further support the precious metal.
Gold prices are trading lower following the prior retracement from the resistance level. MACD has illustrated increasing bearish momentum, while RSI is at 65, suggesting the commodity might extend its losses since the RSI retreated from overbought territory.
Resistance level: 2050.00, 2080.00.
Support level: 2025.00, 2005.00.
GBP/USD
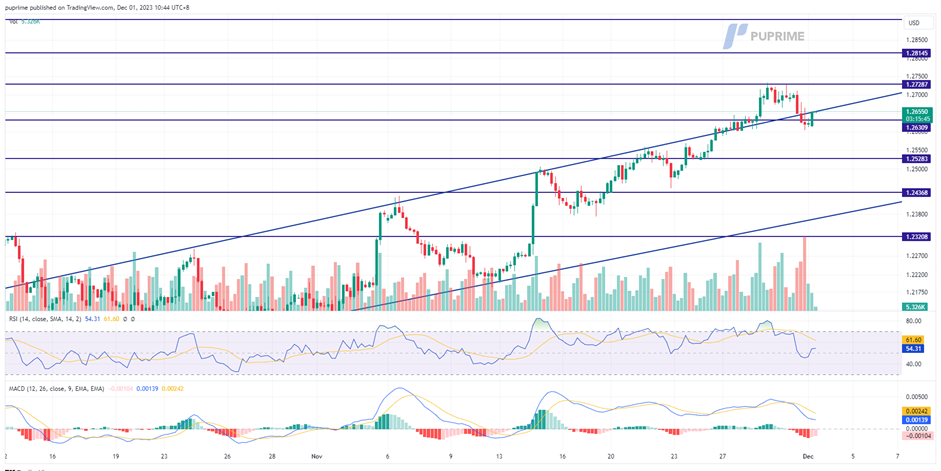
The Cable secured support following a brief technical retracement, positioned above the uptrend resistance level. The U.S. dollar exhibited a decline subsequent to the release of the U.S. PCE, aligning with market expectations and indicating a moderation in U.S. inflation. This economic data has persuaded the market that the probability of additional rate hikes by the Federal Reserve has diminished.
The Cable found support after a technical retracement and is still trading at an elevated level, suggesting the bullish bias remained. The RSI declined from the overbought zone while the MACD fell toward the zero line, suggesting the bullish momentum has eased drastically.
Resistance level: 1.2729 1.2815.
Support level: 1.2630, 1.2528.
EUR/USD
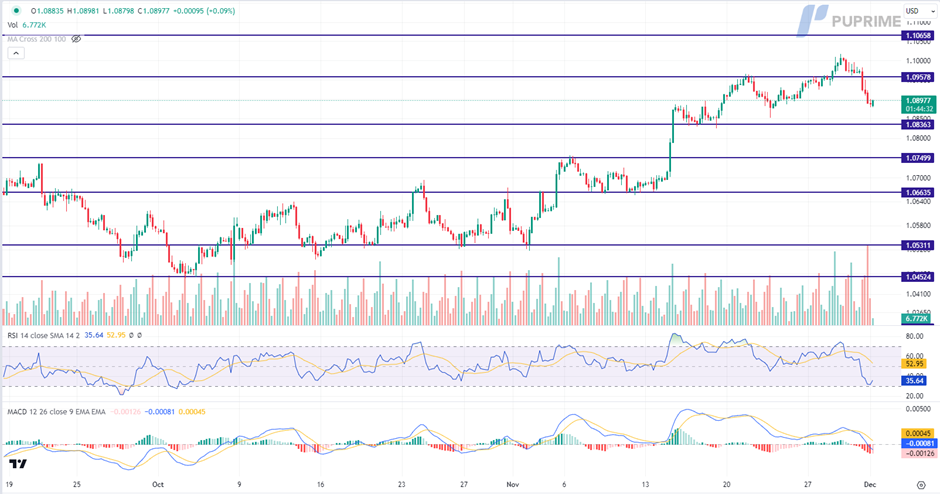
The Euro faces downward pressure as Eurostat data reveals a slowdown in the eurozone's inflation rate to 2.40% on a yearly basis in November 2023. This figure is down from 2.90% in October and falls below market expectations of 2.70%. The decline in inflation renews focus on the European Central Bank's 2% target, hinting at a potential shift in monetary policy.
EUR/USD is trading lower following the prior retracement from the resistance level. However, MACD has illustrated diminishing bearish momentum, while RSI is at 36, suggesting the pair might enter oversold territory.
Resistance level: 1.0960, 1.1065.
Support level: 1.0835, 1.0750.
Dow Jones
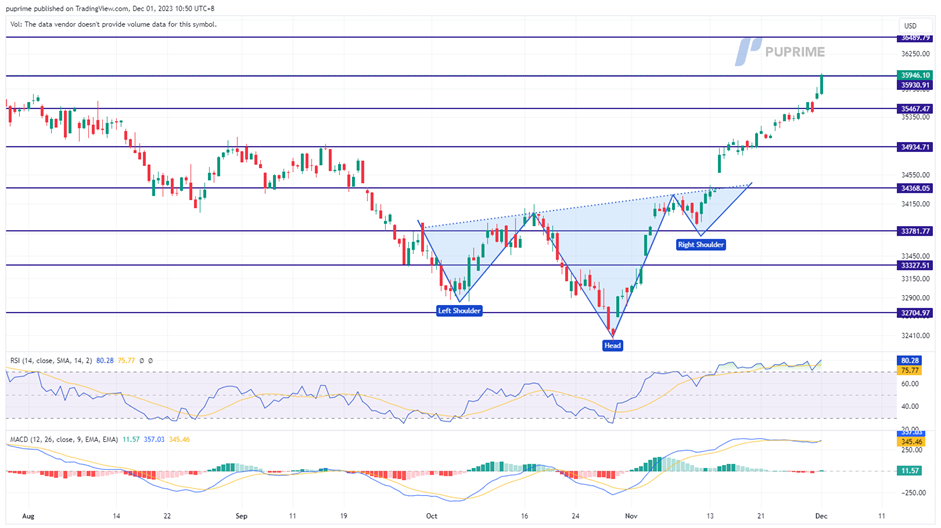
Last night, US equity markets surged by 520 points, reaching their highest level since January 2022. The impetus behind this notable upswing was primarily the PCE data, indicating a cooling trend in U.S. inflation. Additionally, key components, such as Salesforce, exceeded easing expectations, further contributing to the overall strength of the index. Marking its best month in 2023, the index anticipates continued bullish momentum into December.
The Dow is currently trading with an extremely bullish momentum, suggesting the bullish bias continues. The RSI has been flowing in the overbought zone for nearly a week while the MACD continue to flow at an elevated level, suggesting the bullish momentum remains strong.
Resistance level: 35465.00, 35930.00.
Support level: 34935.00, 34370.00.
USD/JPY
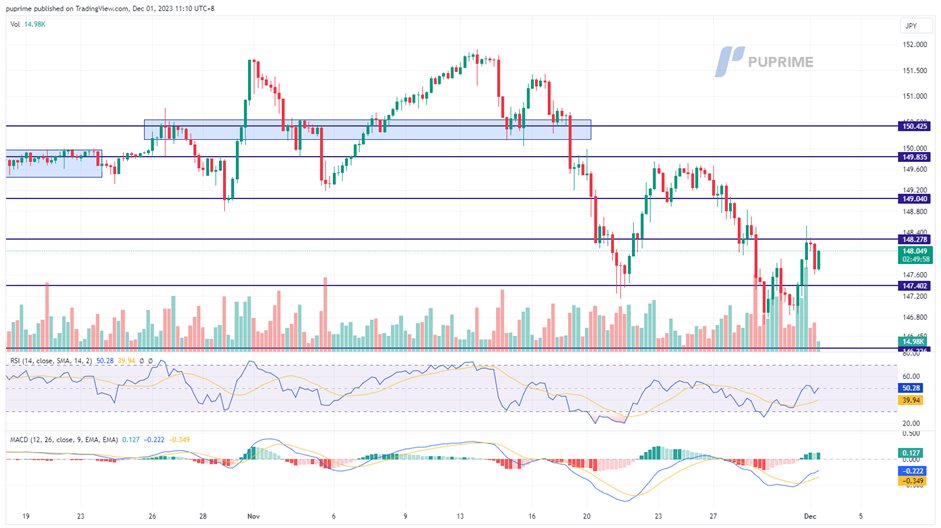
The USD/JPY pair experienced a fluctuating price movement, exhibiting a seesaw pattern following a three-session decline at the beginning of the week. The Japanese Yen maintained its strength, supported by a sustainable inflation rate in Japan. Conversely, the U.S. dollar faced hindrance due to the downbeat PCE data revealed last night. All attention is directed towards Jerome Powell, the Fed's chair, who is scheduled to speak later today. Market participants eagerly await his insights on the inflation issue and potential monetary policy moves from the Federal Reserve.
The USD/JPY rebounded after it slid for 3 straight sessions. The RSI has also broken above from the oversold zone while the MACD is climbing toward the zero line from below, suggesting the bearish momentum has eased drastically.
Resistance level: 148.30, 149.05.
Support level: 147.40, 146.20.
BTC/USD
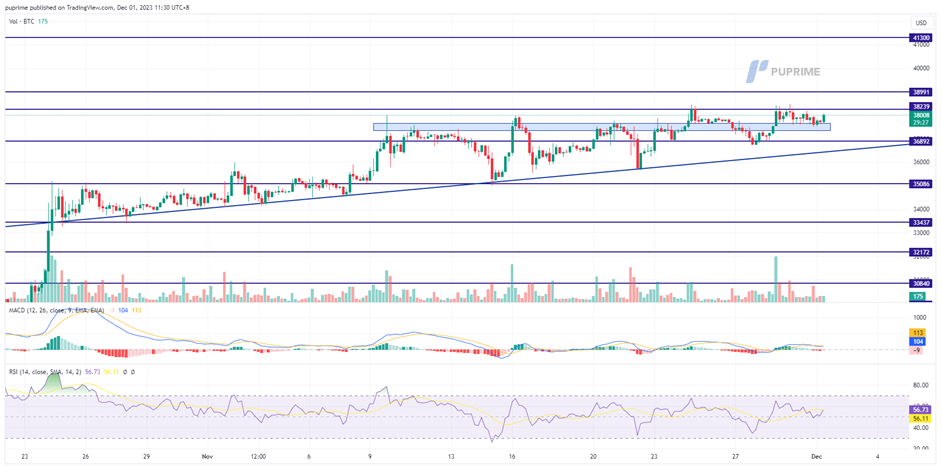
BTC has staged a rebound from a pivotal liquidity zone, signalling a bullish momentum for the cryptocurrency. The overall sentiment in the crypto market is buoyed by a risk-on atmosphere, propelled by the U.S. PCE readings indicating a potential easing of U.S. inflation. This has led the market to entertain the possibility of rate cuts by the Federal Reserve in the coming year. Despite the crypto market lacking a specific catalyst, as the SEC has deferred its BTC ETF decision to January next year, it currently hinges on macroeconomic developments for direction.
BTC prices rebounded on the liquidity zone but still facing a strong resistance level at $38250 region. The MACD flows flat near the zero line while the RSI hovering near the 50-level gives a neutral signal for BTC price movement.
Resistance level: 38240, 38990.
Support level: 36890, 35000.
CL Oil
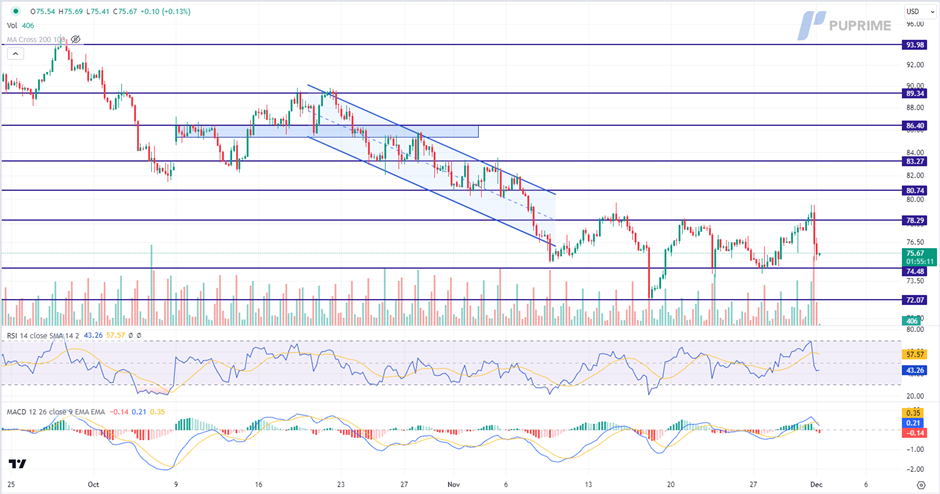
Oil prices decline despite OPEC+ announcing an unexpected cut of about 900,000 barrels per day. Concerns about a stagnant global economy and perceptions that the supply cuts may fall short of boosting prices weigh on market sentiment. In addition, lack of consensus among OPEC+ nations and the view that the cuts are largely voluntary contribute to heightened uncertainties, exerting downward pressure on oil prices.
Oil prices are trading lower following the prior retracement from the resistance level. MACD has illustrated increasing bearish momentum, while RSI is at 43, suggesting the commodity might extend its losses since the RSI stays below the midline.
Resistance level: 78.30, 80.75.
Support level: 74.50, 72.05.
Author

PU Prime team
PU Prime
PU Prime is an award-winning CFD broker offering clients access to multiple products across multiple asset classes. Traders will have access to FX, Commodities, Indices, Share CFDs and Bonds.


