Oil Price Forecast: WTI sell-off to continue, albeit after a minor recovery rally

WTI oil is currently trading at $63.00 - down 18 percent from the yearly high of $76.90 hit on Oct. 3.
The short-term charts are indicating that the sell-off has likely run out of steam. The long-term charts, however, are favoring a further slide to support of the trendline drawn from the February 2016 low and June 2017 low, currently at $59.00.
Monthly chart

Chart source: Netstation
As can be seen, WTI failed to beat the trendline from 2008 highs and ended up creating a bearish outside reversal last month. That candlestick pattern represents a bullish-to-bearish trend change.
What's more, the 5-month and 10-month SMAs have rolled over in favor of the bears and could produce a bearish crossover. Prices have also found acceptance under the 200-month SMA, having failed to clear the 100-month SMA twice in the last four months.
Weekly chart
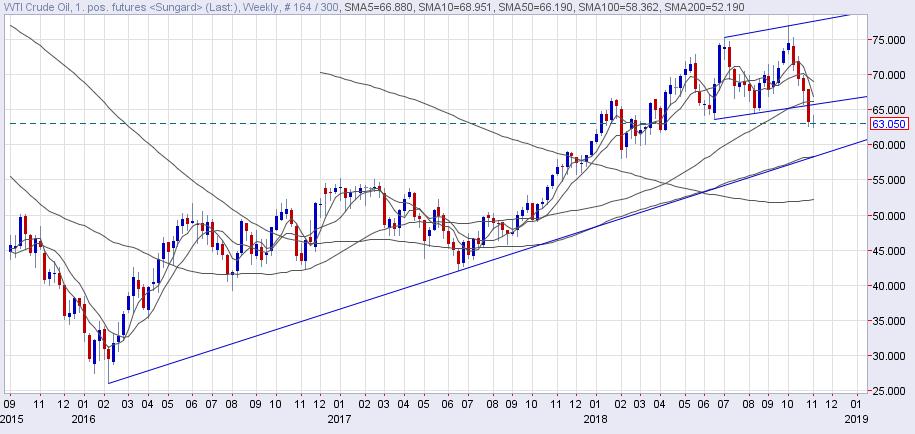
Chart source: Netstation
Over on the weekly chart, WTI closed below the channel support last week, opening the doors for a deeper loss.
The 5-, 10-week SMAs are trending south, having charted a bearish crossover in the previous weeks.
Looking at the monthly and weekly chart, it appears that the bears will likely have more say in determining the price of oil in the near future. As a result, a drop to the rising trendline (from Feb. 2016 low) could be in the offing before the end of the calendar year.
The drop to trendline support, however, is more likely to happen after a minor corrective rally.
Daily chart
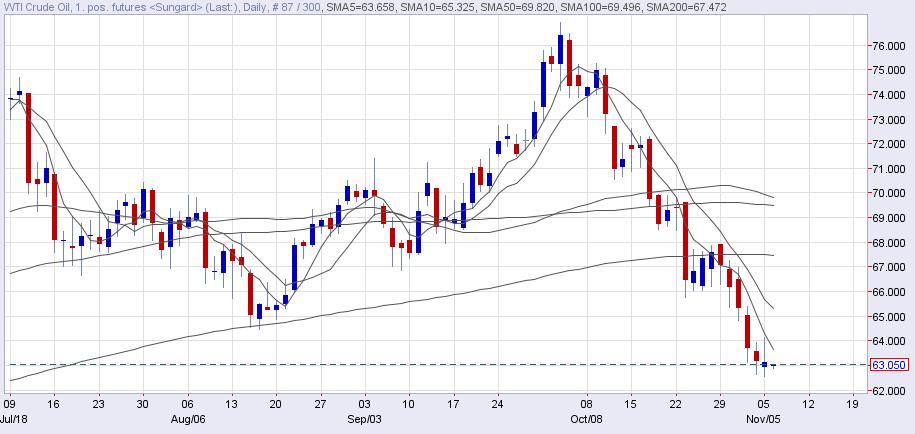
Chart source: Netstation
WTI created a spinning bottom candle yesterday, which is widely considered a sign of indecision. However, in WTI's case, it has appeared at the bottom of the recent slide, hence it could be considered a sign of bearish exhaustion. A short-term bullish reversal would be confirmed if today's candle closes above yesterday's high of $64.14.
Moreover, a bullish close is likely to happen as the RSI on the hourly and 4-hour chart has diverged in favor of the bulls.
To conclude, WTI could see a recovery rally to downward sloping 10-day SMA, currently at $65.32, before resuming the sell-off toward the support of the trendline rising from February 2016 lows.
Author

Omkar Godbole
FXStreet Contributor
Omkar Godbole, editor and analyst, joined FXStreet after four years as a research analyst at several Indian brokerage companies.


