Oil price analysis: BP and EOG candlestick formations

Last week, the market’s battles brought important technical changes and formations. What are the implications?
BP – Bulls vs. Gaps
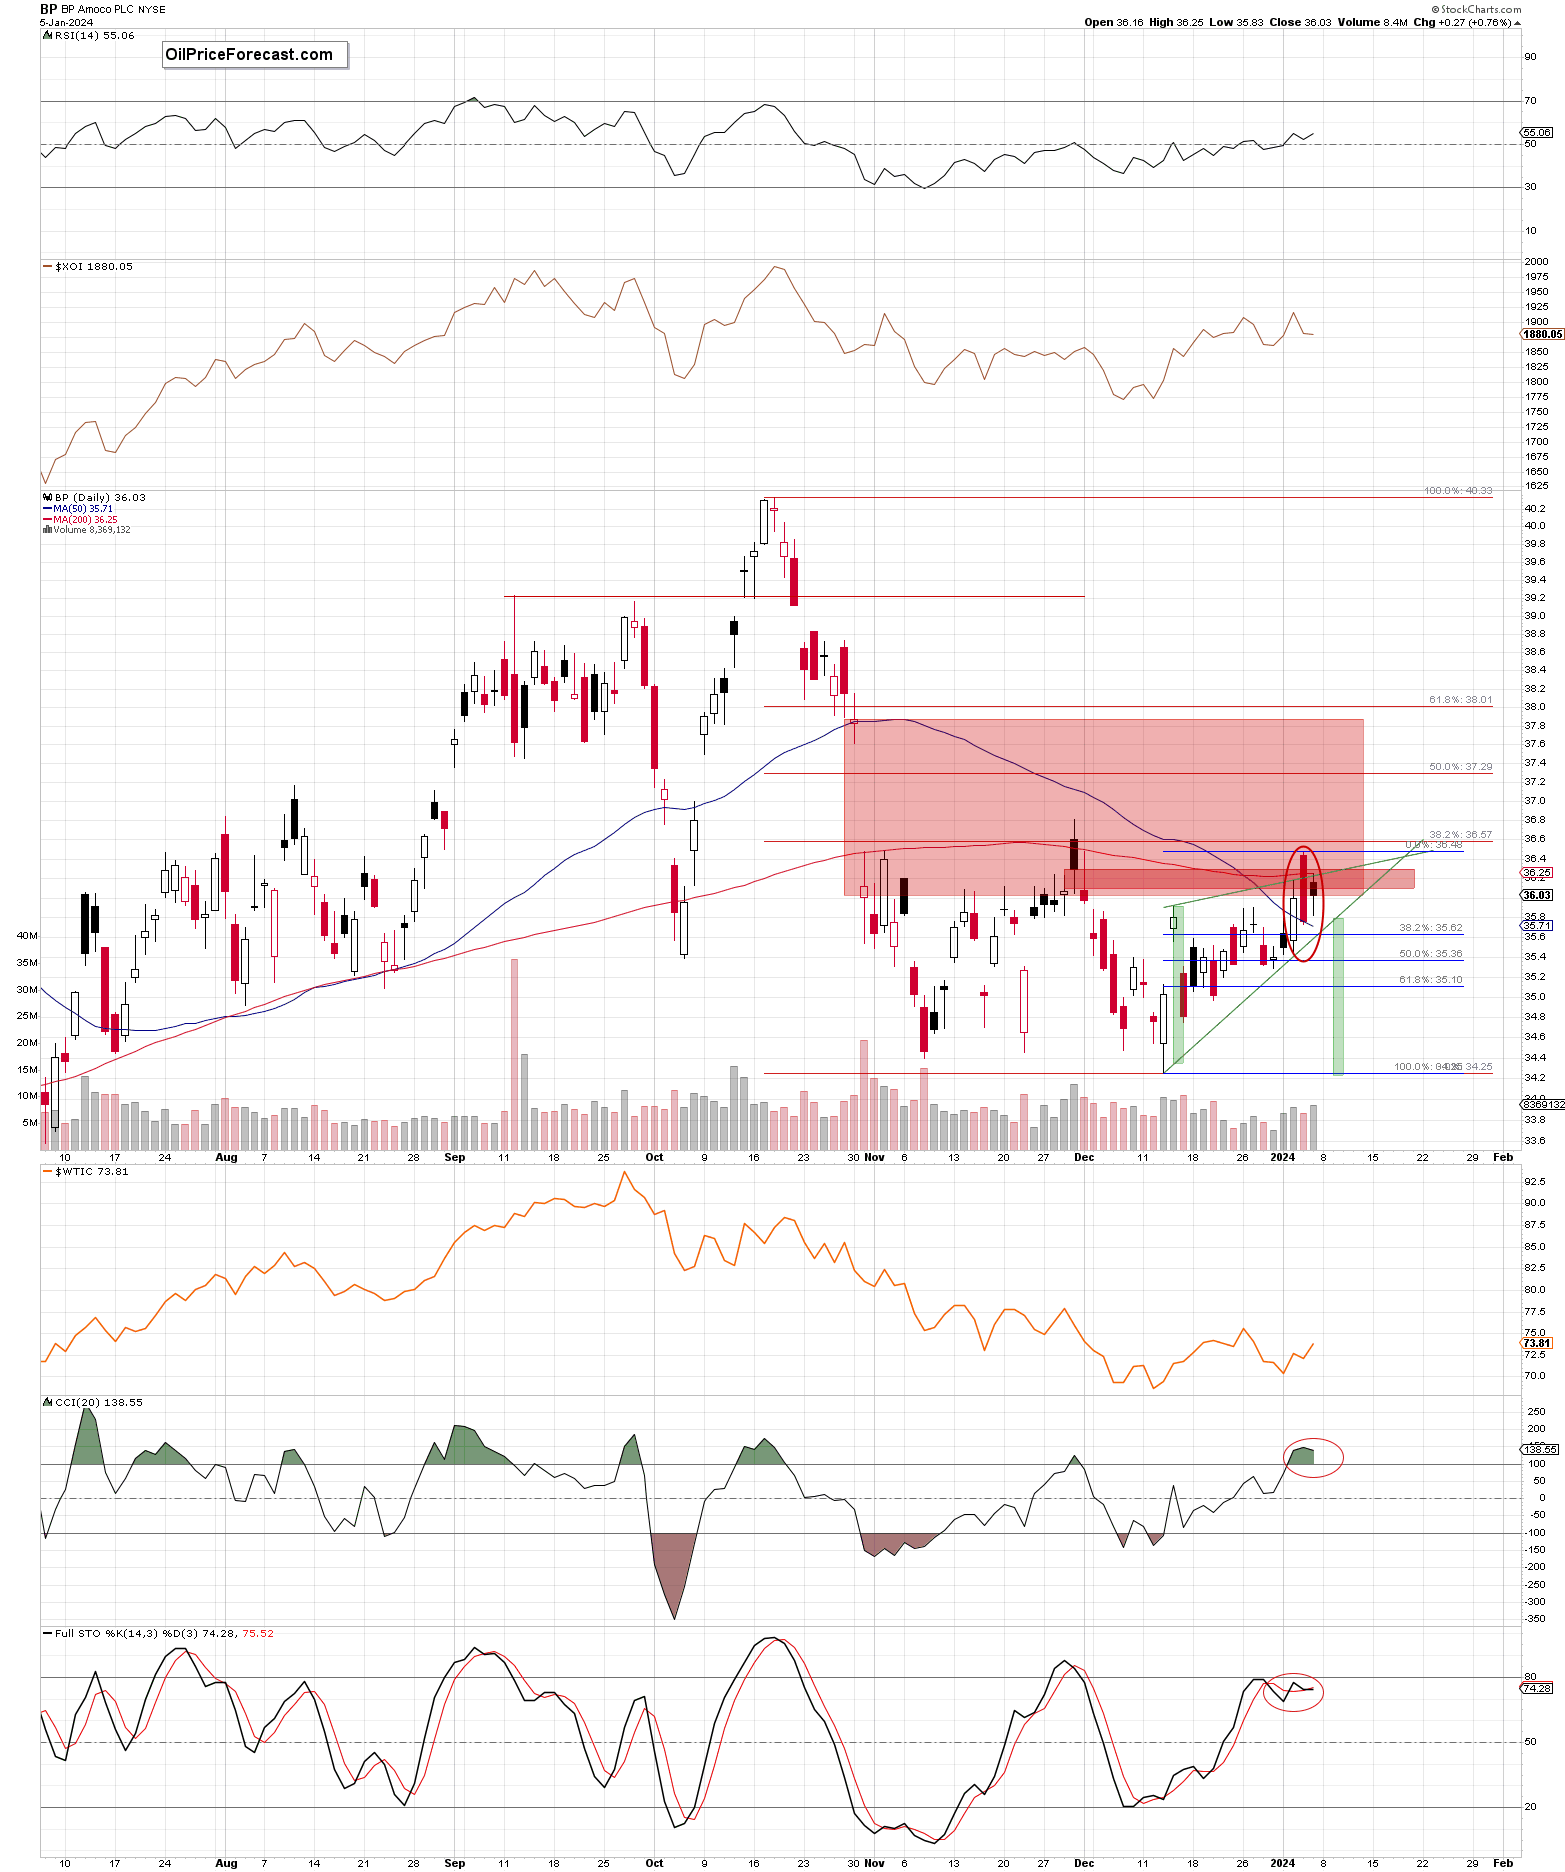
Looking at the daily chart, we see that although the bulls managed to push the price of the stocks to a fresh multi-week high in the previous week, the combination of the huge red gap (36-37.87) created on Oct.31, 2023 and the red gap (36.08-36.29) formed on Dec.1, 2023 with the proximity to the 38.2% Fibonacci retracement (based on the entire October-December downward move) encouraged the sellers to act.
Thanks to their attack, a big red candle was formed on Jan.4, which, together with a white candle in front of it, created a dark cloud covering a bearish reversal candlestick pattern. Additionally, the mentioned red candle invalidated the earlier small breakout above the green rising resistance line (based on the previous peaks), which is also the upper border of the green rising wedge, increasing the probability of further deterioration in the coming days.
This scenario is also reinforced by the current position of the daily indicators: the CCI remains in its overbought area, signaling that a sell signal may be just around the corner, while the Stochastic Oscillator generated already a sell signal, encouraging the sellers.
On top of that, when we take a closer look at the chart, we can notice that the bulls tried to push the price higher on Friday, but they failed, which, combined with earlier pro-declining technical factors, suggests that we’ll likely see at least a test of the lower border of the green rising wedge in the coming week (currently at around 35.66).
However, if this support is broken, the way to the 50% Fibonacci retracement (based on the recent upward move) and the late Dec. low of 35.28 will be open. If the bulls fail here, we could see a test of the next support area created by the 61.8% Fibonacci retracement and Dec. 20 low (around 34.97-35.10).
Nevertheless, taking into account a potential breakdown under the lower border of the green rising wedge, the minimal size of the downward move could result even in a test of the mid-Dec. low of 34.25. Therefore, keeping an eye on the bulls’ behavior (and the volume during declines) in the above-mentioned support areas could give us more clues about the size of the move to the downside and the probability of reversal.
Summing up, the bulls failed, facing two previously formed red price gaps, which resulted in a reversal, invalidation of the earlier breakout above the upper line of the rising wedge, and a creation of strong bearish candlestick formation, which suggests that further deterioration and realization of the bearish scenario is just around the corner.
EOG resources – Surprise
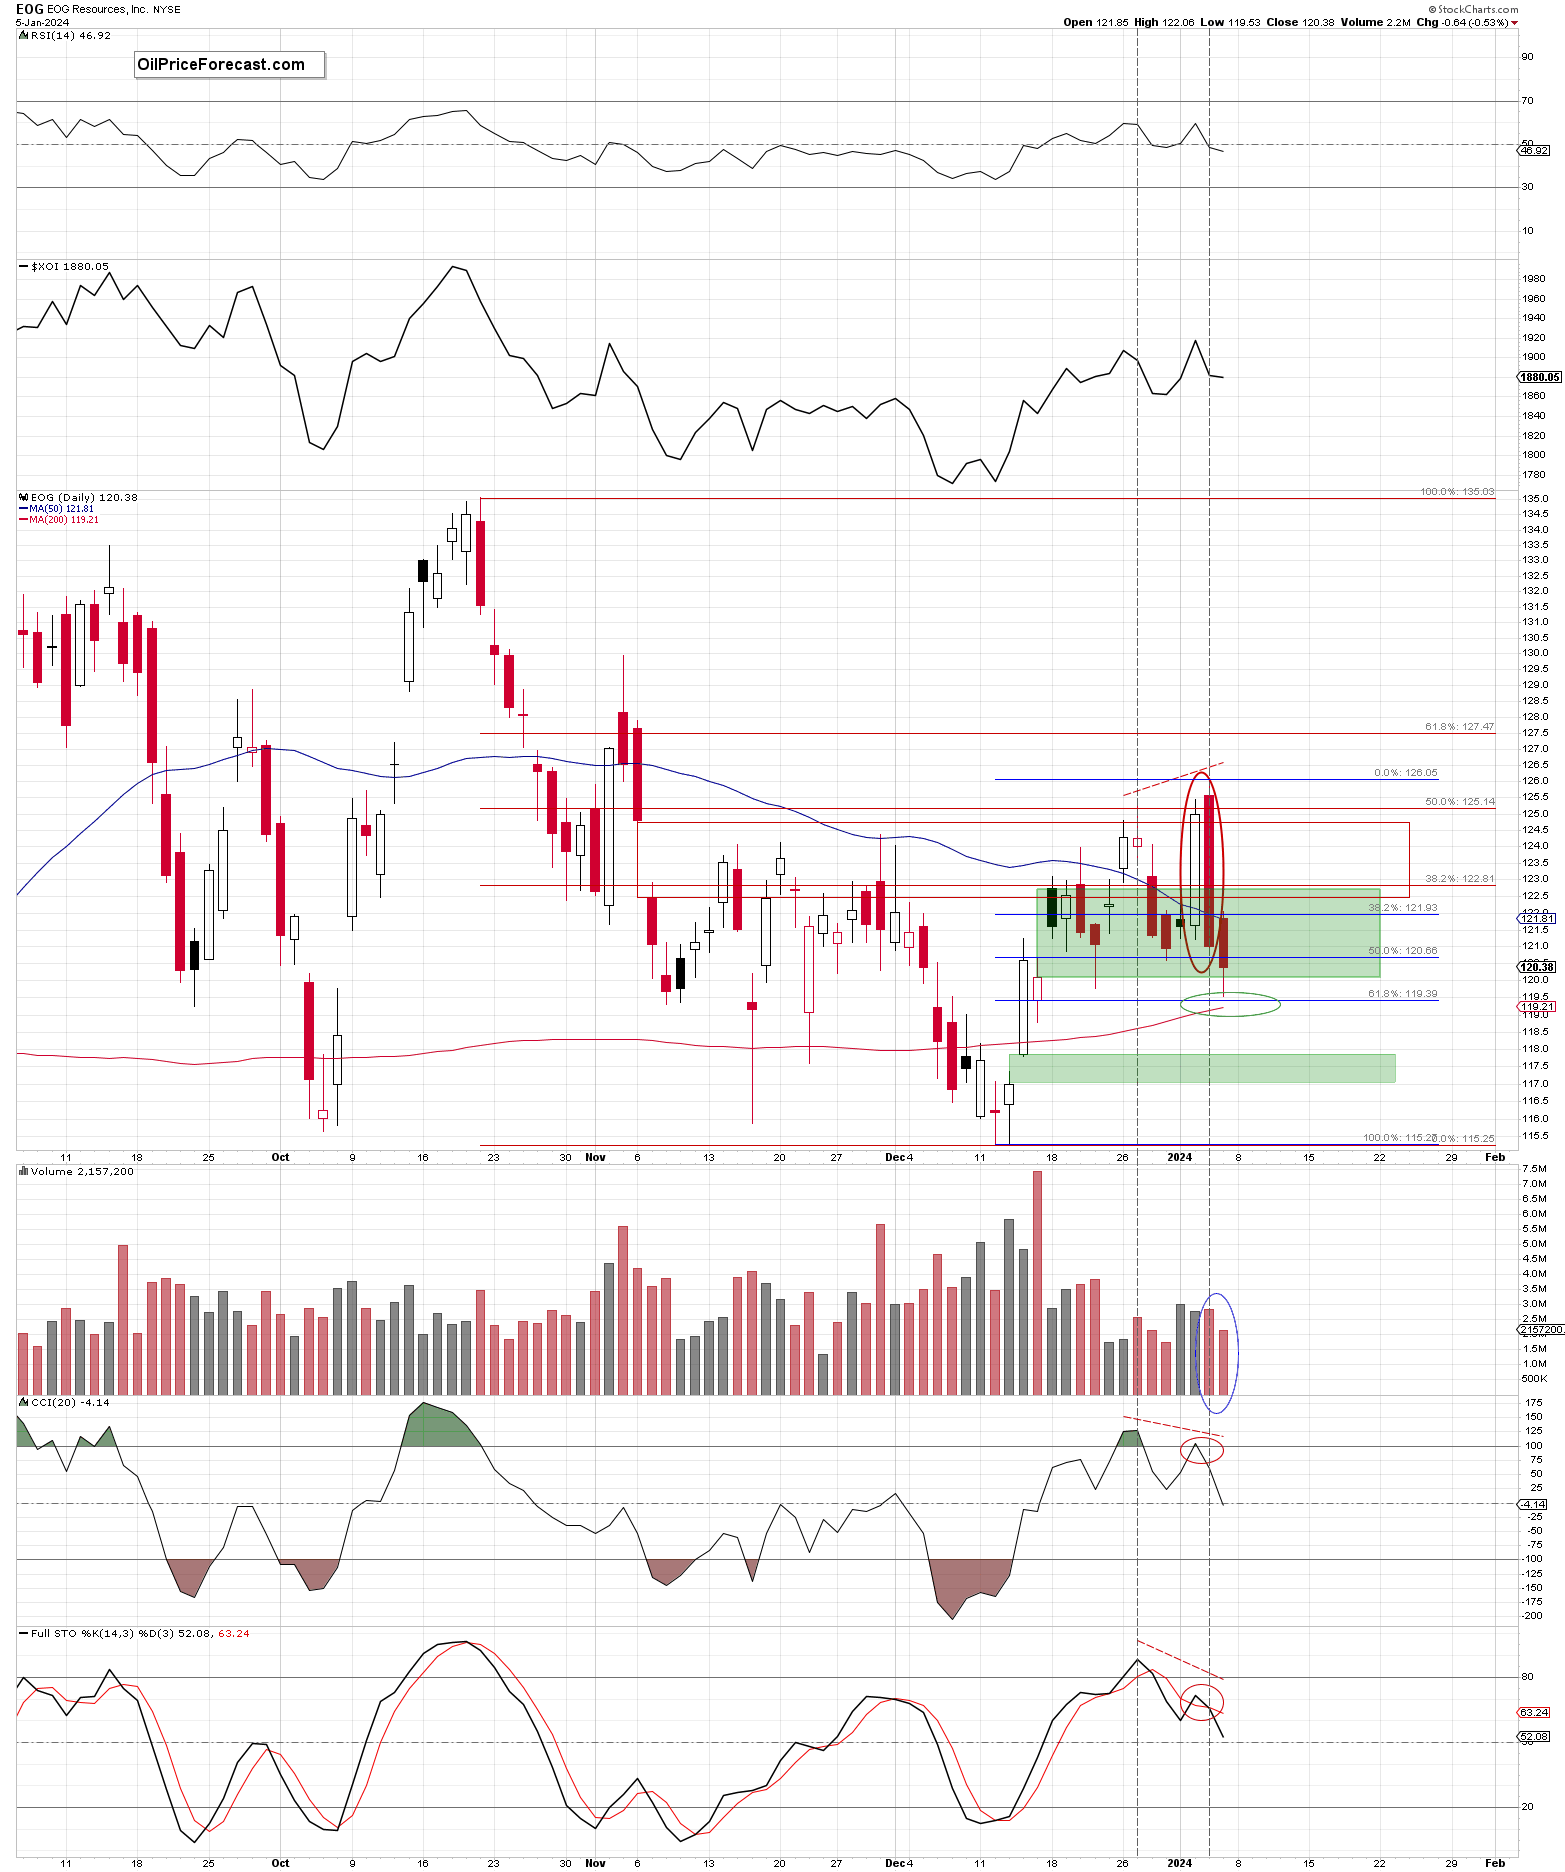
From today’s point of view, we see that the bulls pushed the price to the highest level since Nov.7, 2023, in the previous week. Despite this improvement, they didn’t manage to hold gained levels as the 50% Fibonacci retracement was enough to stop their march northwards.
When we take a closer look at the chart, we can read this behavior as a very strong sign of weakness. Why? Because the day before, buyers formed a large white candle that managed to close the price gap created on Nov.7. Such price action should encourage the buyers to fight for higher prices. Instead, the stocks reversed and declined, creating a huge bearish engulfing candlestick pattern, which invalidated not only the breakout above the mentioned 50% Fibonacci retracement but also the breakout above the pearlier peak formed on Dec.27.
This is a strong pro-declining sign, which suggests further deterioration in the coming week – especially when we factor in negative divergences between the CCI, the Stochastic Oscillator, and the price and sell signals generated by these indicators.
Nevertheless, the way to the south would be even more open if the bears managed to close the green gap (120.11-122.75) created on Dec.18, which serves as the nearest support. In this case, the first downside target would be the support area created by the 61.8% Fibonacci retracement and the 200-day moving average (around 119.21-119.39).
However, if the bulls fail to hold these supports, the way to the green gap (116.98-117.87) formed on Dec. 14, 2023, will be likely open.
Before today’s summary, it’s worth mentioning that the sellers tested the lower border of the green gap from mid-December, but failed to close it, which, together with the lower volume that accompanied Friday’s candlestick suggests that we may witness an interesting game between market participants in this region. In my opinion, the result of the battle here will determine whether we will see a rebound or a test of lower supports.
Summing up, the bulls showed their weakness, which translated into an invalidation of the earlier breakouts and formation of a huge pro-declining candlestick formation, which together with the Fibonacci retracement, blocks the way to the north at the moment. Nevertheless, the nearest support is still holding, which, together with a lower volume, suggests that it’s worth to keeping an eye on the price in this area (around the lower border of the green gap) because the result of the battle between bulls and bears here may show us the direction of the next bigger move.
Want free follow-ups to the above article and details not available to 99%+ investors? Sign up to our free newsletter today!
Want free follow-ups to the above article and details not available to 99%+ investors? Sign up to our free newsletter today!
Author

Przemyslaw Radomski, CFA
Sunshine Profits
Przemyslaw Radomski, CFA (PR) is a precious metals investor and analyst who takes advantage of the emotionality on the markets, and invites you to do the same. His company, Sunshine Profits, publishes analytical software that any


