WTI outlook: Upside potential for Oil prices present

Since our last report oil prices have been edging higher yet their rise may be characterised as timid. On a fundamental level, we intend to have a look at the state of the US oil market, the demand for the commodity as well as any supply chain issues possibly affecting its price. For a rounder view we are to conclude with a technical analysis of WTI’s daily chart.
Further easing of the US Oil market could weigh on Oil prices
We make a start with the US oil market comment by noting that as per the Baker Hughes US oil rig count, the number of active oil rigs in the States dropped nine, which could potentially be signalling an easing of oil demand in the US, which may have been the reason behind the shut-down of the nine oil rigs. The signal was amplified late Tuesday as API reported an unexpected increase of the US oil reserves by 2.4 million barrels. The increase of US oil inventories was also verified by EIA on Wednesday but by a lower amount , this time by around half a million barrels. Yet in both cases the increase of US oil inventories tends to point towards aa loosening US oil market as oil production levels surpassed aggregated demand for the commodity thus creating a slack in the US oil market. For the time being the market seems to have shook off the signals send by the US market pointing out that fundamental reasons behind the slight rise of oil prices in the past few days should be searched elsewhere. Yet we note that should the slack in the US oil market continue or even magnify in the coming week, we may see it weighing on oil prices.
Signals of tightening supply support Oil prices
On the supply side we note the new US sanctions on Chinese importers of Iranian oil as a key issue. The US administration issued new sanctions against exports of Iranian oil, including a China-based "teapot" oil refinery, as per Reuters. The move is expected to increase pressure on Chinese oil refiners and may have negative side-effects for the export of Iranian oil as US President Trump is trying to implement the “zero exports of Iranian oil” policy. It should be noted that the US Government is entering negotiations with Iran in regards to its nuclear programme and the move may be an effort to soften the Iranian side before their commencement. Overall the increase of US sanctions on Iranian exports of oil is expected to increase the strain on international oil supply thus understandably has a bullish effect on oil prices. Also a second issue in relation to the supply side of the international oil market is the decision of Kazakhstan and Iraq to reduce their oil output levels to compensate for past overproduction, which in turn may strain oil supply chains further and also could have a bullish effect on oil prices. In general any signals of tightening supply ion the international oil market may have a bullish effect on oil prices to one degree or the other, depending on their magnitude.
Pessimistic Oil demand outlook may be clipping gains
On the demand side of the international oil market, the outlook remains rather pessimistic given the uncertainty caused by US President Trump’s trade war. It should be noted that the issue is still surrounded by confusion as the updates are ongoing with no end in sight, at least not yet. We expect the issue to continue to feed oil bears in the coming days, should the next developments increase market worries for the possible negative consequences for US tariffs and reciprocal tariffs on US products, on global trade and economic activity. On the flip side a possible easing of market worries could lift oil prices.
Technical analysis
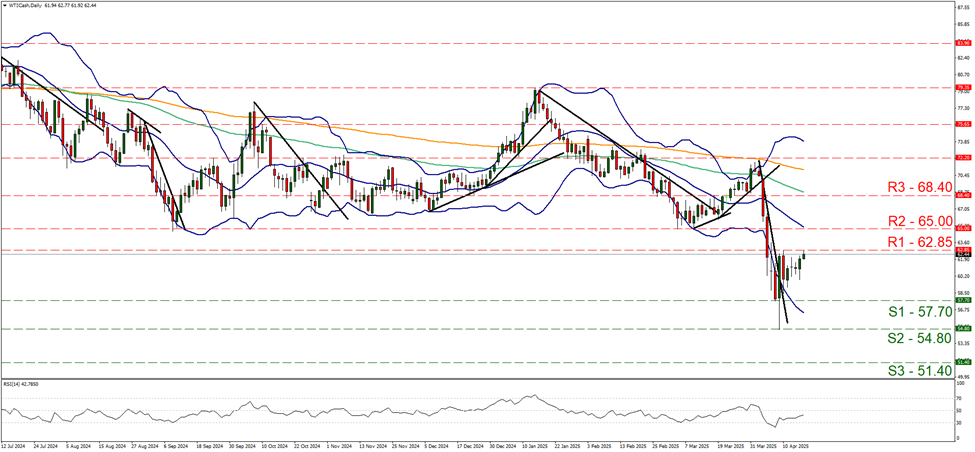
WTI cash daily chart
-
Support: 57.70 (S1), 54.80 (S2), 51.40 (S3).
-
Resistance: 62.85 (R1), 65.00 (R2), 68.40 (R3).
WTI’s price action was on the rise over the past few days and during today’s Asian session tested the 62.85 (R1) resistance line. Despite the upward movement we do not adopt a bullish outlook yet as the R1 remains intact and the RSI indicator despite rising yet remaining well below the reading off 50, which could imply that the bearish sentiment may be easing yet is still present for the commodity’s price. Hence for the time being we adopt a sideways motion between the 62.85 (R1) resistance line and the 57.70 (S1) support level, yet we issue a warning for any possible bullish tendencies of WTIs’ price. For the adoption of a bullish outlook, we would require WTI’s price to break the 62.85 (R1) resistance line and start aiming if not even breaching the 65.00 (R2) resistance level, with the next possible target for the bulls being the 68.40 (R3) resistance base. For a bearish outlook we would require WTI’s price to drop breaking the 57.70 (S1) support line clearly and continue lower aiming if not reaching the 54.80 (S2) support level, while even lower the price action may meet up with the 51.40 (S3) support hurdle.
Author

Peter Iosif, ACA, MBA
IronFX
Mr. Iosif joined IronFX in 2017 as part of the sales force. His high level of competence and expertise enabled him to climb up the company ladder quickly and move to the IronFX Strategy team as a Research Analyst. Mr.


