Oil outlook: Trump’s motto of “drill baby drill”

Oil prices have moved decisively lower since our last report, highlighting the market’s bearish tendencies. Today we are to take a look atthe new US administration’s energy policies in addition to the recent developments in the US oil market. For a rounder view, we are to conclude the report with a technical analysis of WTI’s daily chart.
The Trump energy era
On Monday the 20th of January, Trump was inaugurated as the 47th President of the United States of America. The new administration wasted no time, with the President during his inauguration speech, re-iterating his motto of “drill baby drill”, in addition to refilling the Strategic Petroleum Reserve. The Trump administration appears poised to open the oil tap, with ‘The Hill’ reporting that Trump signed an executive order that seeks to rescind a recent order that was intended to block 625 million acres offshore from oil and gas drilling. In addition, Trump is seeking to revoke another order that had blocked 2.8 million acres in the Arctic Ocean from oil and gas drilling. Overall, it appears that the campaign slogan of “drill baby drill” may be becoming a reality and thus, the implications of an increase in oil supply over the long run, which in turn may exceed demand, appears to have weighed on oil prices. Moreover, President Trump per Reuters declared a national energy emergency, which could speed up the process of drilling and pipeline construction permits. In our view, we would not be surprised to see further measures by the Trump administration in order to facilitate an increase in US oil production, which could facilitate an increase in production which in turn could weigh on oil prices as oil supply may exceed demand.
US Oil market
Making a start with the US oil market we note that Baker Hughes reported a decrease in the number of active oil rigs in the US by two, bringing the figure down from 480 to 478. The release may have been more on the bearish side for oil prices implying that demand levels may have dropped forcing producers to shut down two more rigs. Moreover, that picture appears to have been validated on Wednesday as API reported an increase in US oil inventories by 1 million barrels. The increase tended to imply that oil production levels may have surpassed demand which in turn may have weighed on oil prices. Overall, should data related to the US oil market continue to show oil production levels exceeding demand, it may weigh on oil prices.
Technical analysis
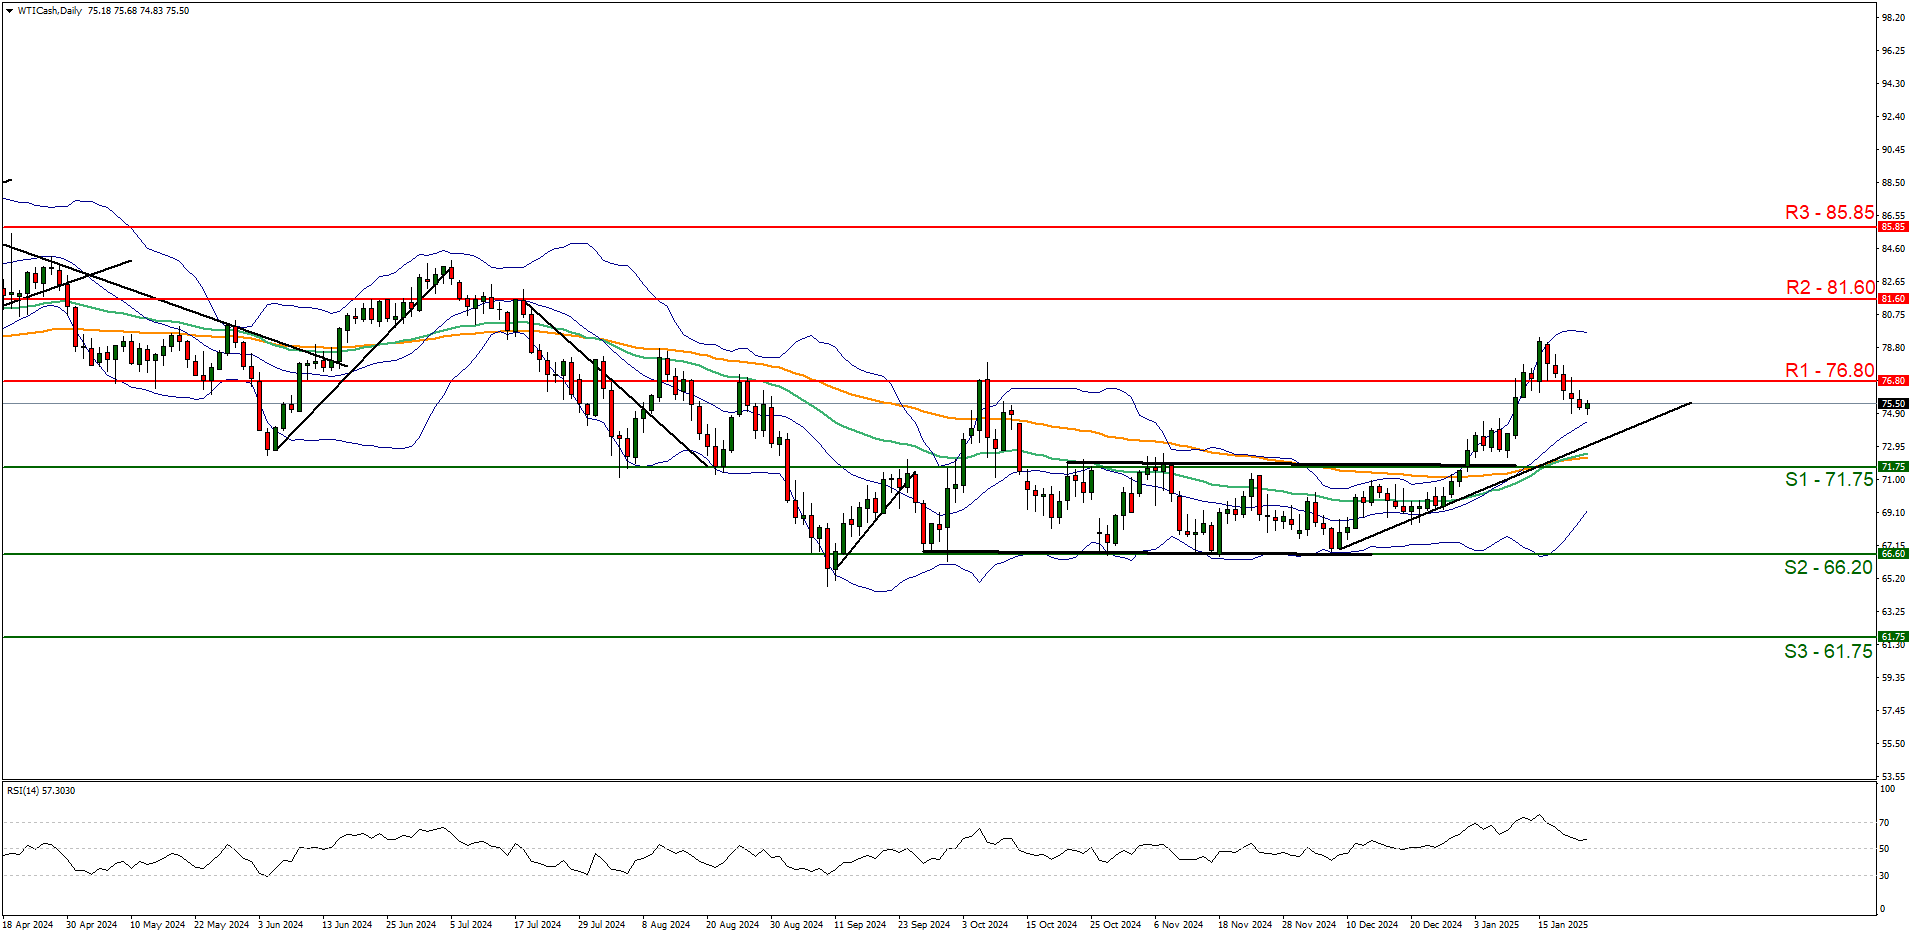
WTI Cash daily chart
Support: 71.75 (S1), 66.20 (S2), 61.75 (S3).
Resistance: 76.80(R1), 81.60 (R2), 85.85 (R3).
WTICash appears to in a predominantly sideways fashion, with the commodity having broken below our support now turned to resistance line at the 71.75 (R1) level. Moreover, we would like to note the RSI indicator below our chart which currently registers a figure near 50, implying a neutral market sentiment and the steep decline from the reading near 70, could also imply that the bullish momentum may have dissipated. On the flip side, we would like to note that the upwards-moving trendline which was incepted on the 9th of December remains intact and a golden cross appears to have been formed, with the 50MA crossing above the 100MA, which tends to imply bullish tendencies in the market in the long run. Nonetheless, for our sideways bias to be maintained we would require the commodity’s price to remain confined between the 71.75 (S1) support level and the 76.80 (R1) resistance line. On the other hand, for a bearish outlook, we would require a break below the 71.75 (S1) support level, with the next possible target for the bears being the 66.20 (S2) support base. Lastly, for a bullish outlook, we would require a clear break above the 76.80 (R1) resistance line with the next possible target for the bulls being the 81.60 (R2) resistance ceiling.
Author

Phaedros Pantelides
Independent Analyst
Mr Pantelides has graduated from the University of Reading with a degree in BSc Business Economics, where he discovered his passion for trading and analyzing global geopolitics.


