Oil outlook: OPEC reduces demand expectations once again

Oil prices appear to have remained relatively unchanged compared to last week. Today we are to take a look at OPEC’s monthly report, the data of the US oil market, and the recent geopolitical issues affecting the supply and demand side of the international oil market. For a rounder view, we are to conclude the report with a technical analysis of WTI’s daily chart.
OPEC slashes Oil demand once again
OPEC has cut oil demand forecast for 2024 and 2025, for the fifth month in a row with the latest revision being the largest yet. In particular, OPEC revised global oil demand to rise by 1.61 mb/d which would be lower than last month’s figure. Moreover, OPEC when referring to world oil demand stated that “In the non-OECD, downward revisions were made to China, India, Other Asia, the Middle East and Africa”. In our view, we are not surprised to see the downward revision in oil demand from China, as we have constantly stressed that the issues facing China’s economy are structural in nature and that they are difficult to solve by simply “throwing” money at the problem. Overall, should OPEC continue its downward revisions on global oil demand, it could weigh on oil prices in the long run. Whereas, should we see economic activity in China increasing, and thus an increase in oil demand from the world’s largest customer of the liquid gold, it could aid oil prices.
US Oil market data
In the US oil market data tended to send out relatively mixed signals once again. As usual, we make a start with the US Baker Hughes oil rig count, which showed that the number of active oil rigs has increased by five reaching 482. The opening of five oil rigs tends to imply an uptick in the demand side for the US oil market, which could be considered as bullish for oil prices. On Tuesday however, the weekly API crude oil inventories figure tended to counter our argument, with the figure coming in higher than expected. In particular, the figure came in at 0.499M versus the expected figure of -1.300M, hence implying an increase in US oil inventories which could infer a reduction in demand for oil from US consumers. On the contrary, EIA reported a drawdown of -1.425 million barrels implying a tightening of the US oil market as the reduction of US oil inventories tended to imply that oil production levels did not reach aggregated oil demand levels. Overall, data on the ground of the US oil market, tended to be inconclusive, yet should we see demand for oil increase in the coming week, it may aid oil prices and vice versa.
Developments in the Middle East
In the Middle East, we note that the situation in Syria since our last report has changed dramatically. The Assad regime has now been toppled and is being replaced by the rebel groups which have now taken over. Moreover, some ceasefire talks between Hamas and Israel appear to be progressing, although we take any developments of progress with a pinch of salt. Nevertheless, the situation in the region appears to be relatively stable for now which in turn could reduce concerns about oil supply chain disruptions in the region. Hence, an easing of tensions and concerns about oil supply stemming from the area could weigh on oil prices. However, should tensions rise once again it could potentially aid oil prices.
Technical analysis
WTI cash daily chart
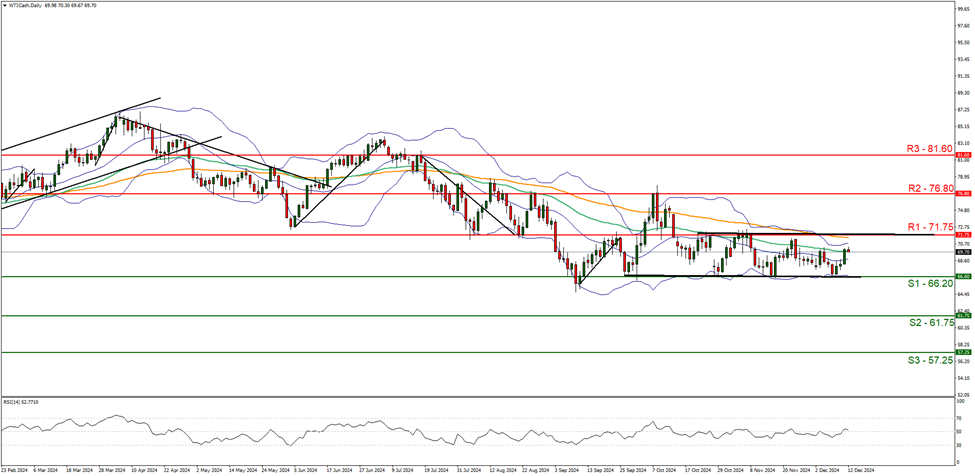
Support: 66.20 (S1), 61.75 (S2), 57.25 (S3).
Resistance: 72.75(R1), 76.80 (R2), 81.60 (R3).
WTI appears to be continuing on its sideways path, remaining confined between the 66.20 (S1) support level and the 71.75 (R1) resistance line. We opt for a sideways bias for the commodity’s price and supporting our case is the RSI indicator our chart which currently registers a figure near 50, implying a neutral market sentiment, in addition to the sideways moving channel which was incepted on the 26th of September. For our sideways bias to continue, we would require the commodity’s price to remain confined between the 66.20 (S1) support level and the 71.75 (R1) resistance line. On the flip side for a bullish outlook, we would require a clear break above the 71.75 (R1) resistance line, with the next possible target for the bulls being the 76.80 (R2) resistance level. Lastly, for a bearish outlook we would require a clear break below the 66.20 (S1) support level, with the next possible target for the bears being the 61.75 (S2) support base
Author

Phaedros Pantelides
IronFX
Mr Pantelides has graduated from the University of Reading with a degree in BSc Business Economics, where he discovered his passion for trading and analyzing global geopolitics.


