WTI outlook: Oil prices in a free fall

Oil prices seem to have sharply dropped with the announcement of tariffs. In the current report we are to discuss the conditions characterising the US oil market currently, as well as factors affecting oil demand and supply in the international oil market. We are to complete the fundamentals included in the report with a technical analysis of WTI’s chart.
US Oil market loosens
We make a start by noting that the US oil market shows signs of loosening. On Friday we note the reduction in the number of active oil rigs in the US, which tends to be a negative sign for oil prices. It’s characteristic that the US Baker Hughes oil rig count dropped by two. Moreover, it’s characteristic that API and the EIA both reported an unexpected increase of US oil inventories by 6.037 million barrels and 6.165 million barrels respectively. The increases reported by the two oil agencies tend to highlight how oil production levels in the US were able to surpass aggregated oil demand, implying a relative slack in demand within the US oil market, an element considered as bearish for oil prices.
Trump announces the US’s retaliatory tariffs
The Trump administration has announced their reciprocal tariffs yesterday on a variety of nations. Specifically, per the statement releases by the White House, the US will impose an ““additional ad valorem duty on all imports from all trading partners shall start at 10 percent and shortly thereafter, the additional ad valorem duty shall increase for trading partners enumerated in Annex I”. In ‘Annex 1’ the reciprocal tariff will be 20% on the EU and 34% on China, with CNBC reporting that the White House clarified that the tariff rate on Beijing comes in addition to the existing 20% tariff on Chinese imports, which would mean the true rate on Chinese imports will rise to 54%. The further imposition of tariffs on Chinese exports to the US may cause harm to the Chinese economy, with Citigroup announcing per Bloomberg that the 54% tariff could lead in a 2.4% reduction in GDP in 2025. In turn the possibility of a negative impact on the Chinese economy, may imply a reduction in demand for oil from the world’s largest oil consumer and thus may weigh on oil’s price. In our view, we have repeatedly stressed our concerns over the resilience of the Chinese economy and thus with the 54% tariff being imposed on the nation’s exports to the US, we would not be surprised to see economic hardship ensuing which in turn may weigh on oil’s price even further should Chinese oil demand decrease.
OPEC+ to boost supply
OPEC+ met earlier on today, with the oil cartel agreeing to advance their plan for oil output hikes, with OPEC stating on their website that they will be increasing oil output by 411,000 barrels per day in May. The announcement by OPEC essentially implies that the oil cartel will be accelerating their supply hike which in turn could weigh on the commodity’s price. However, it should be noted that OPEC did also state that “The gradual increases may be paused or reversed subject to evolving market conditions” which keeps the door open for OPEC+ should they wish to revert some of their decisions. Nonetheless, the oil cartel’s decision may weigh on oil prices.
Technical analysis
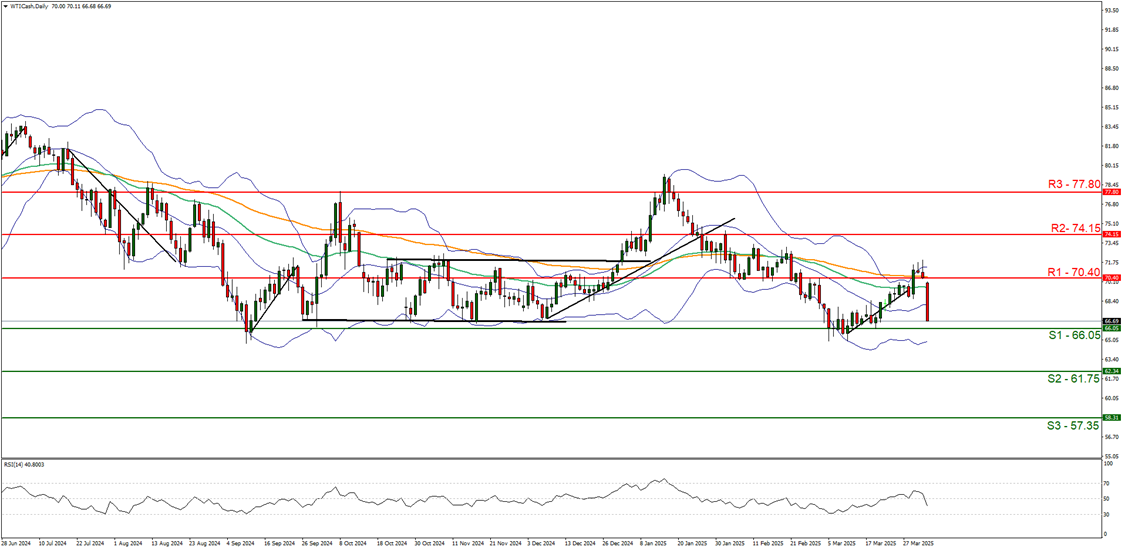
WTI cash daily chart
-
Support: 66.05 (S1), 61.75 (S2), 57.35 (S3).
-
Resistance: 70.40 (R1), 74.15 (R2), 77.80 (R3).
WTI’s appears to be moving in a downwards fashion with the commodity currently appearing to be aiming for our 66.05 (S1) support level. We opt for a bearish outlook for the commodity’s price and supporting our case is the RSI indicator below our chart which currently registers a figure of 40 implying a bearish market sentiment. For our bearish outlook to continue we would require a clear break below the 66.05 (S1) support level, with the next possible target for the bears being the 61.75 (S2) support line. On the flip side, for a sideways bias we would require the pair to remain confined between the 66.05 (S1) support line and the 70.40 (R1) resistance line. Lastly, for a bullish outlook we would require a clear break above the 70.40 (R1) resistance level, with the next possible target for the bulls being the 74.15 (R2) resistance line.
Author

Phaedros Pantelides
IronFX
Mr Pantelides has graduated from the University of Reading with a degree in BSc Business Economics, where he discovered his passion for trading and analyzing global geopolitics.


