WTI outlook: Oil prices in a free-fall

Oil prices seem to have maintained their bearish tendencies since the start for the week. In today’s report we are to take a look at the shifting state of the US oil market, fundamental issues surrounding both the demand and supply side of the commodity and how they could affect its price and conclude the report with a technical analysis of WTI’s daily chart.
The situation of the US Oil market
In the US, signals for the local oil market were encouraging as on Friday Baker Hughes reported a decrease of the active oil rigs from 488 to 486. It should be noted that the decrease marks an end to five straight weeks of increasing in the active oil rigs in the US, signalling possibly a shift in the oil markets, which could be interpreted as bearish for oil prices. Yet, on Tuesday, the API reported an unexpected decrease of US crude oil inventories by 1.455 million barrels vastly exceeding the expected drawdown of -0.3 million barrels. The release, however was contradicted by the EIA’s report later on in the week, which showcased an increase in inventories by 3.614 million barrels. Nonetheless, it appears that the releases may have weighed on oil prices during the week, as concern mounts about the future demand for oil. Should we see additional signs of the US oil market weakening we may see the data weighing on oil prices in the coming week.
The Trade wars have begun
US President Trump went through with the imposition of a 25% tariff on imports from Mexico and Canada on Tuesday, alongside increasing fresh duties on Chinese goods. The implementation of tariffs appears to have led to retaliatory measures from Canada, with Prime Minister Trudeau announcing retaliatory tariffs on US exports. In turn this may increase market worries, as the spat between the two countries continues to escalate with Trump responding on a TruthSocial post that “Please explain to Governor Trudeau, of Canada, that when he puts on a Retaliatory Tariff on the U.S., our Reciprocal Tariff will immediately increase by a like amount!”, implying that the trade war may continue to escalate. In turn the trade wars have sparked concern in regards to their impact on economic activity and thus may have weighed on oil prices, as a gloomy economic outlook may imply a reduction in demand for oil as a result. However, on Wednesday, President Trump stated that he will exempt automakers from his 25% tariff on Mexico and Canada for one month, as long as they comply with existing free trade rules, per Reuters. The announcement may imply that the President’s tariffs are amenable to some extent and could be loosened or modified in the future. Should that appear to be the case, oil prices may find some support. Nevertheless, it appears that the administration may continue with the imposition of tariffs which have already resulted in a retaliation by the affected countries. Hence, should they be maintained or expanded to include other nations, it could weigh on oil prices. In our view, we would not be surprised to see tariffs being imposed on other countries and bloc’s such as the EU, which could further dampen the mood on the global economic outlook and could thus weigh on oil prices in the future.
OPEC+ confirms increase in production
OPEC+ on Monday announced that “ The eight OPEC+ countries, which previously announced additional voluntary adjustments in April and November 2023, namely Saudi Arabia, Russia, Iraq, the United Arab Emirates, Kuwait, Kazakhstan, Algeria, and Oman met virtually on March 3, 2025, to review global market conditions and the future outlook” and that they “re-affirmed their decision agreed upon on December 5, 2024, to proceed with a gradual and flexible return of the 2.2 mbd voluntary adjustments starting on 1st April, 2025”. Essentially implying that OPEC+ may be proceeding with their decision to increase the production of oil and thus possibly increase supply, which in turn could weigh on oil prices. Hence should OPEC+ go through with their intention of increasing oil production, it could weigh on oil prices. Yet, should they decide to renege on their decision, it could instead aid oil prices.
Technical analysis
WTI cash daily chart
-
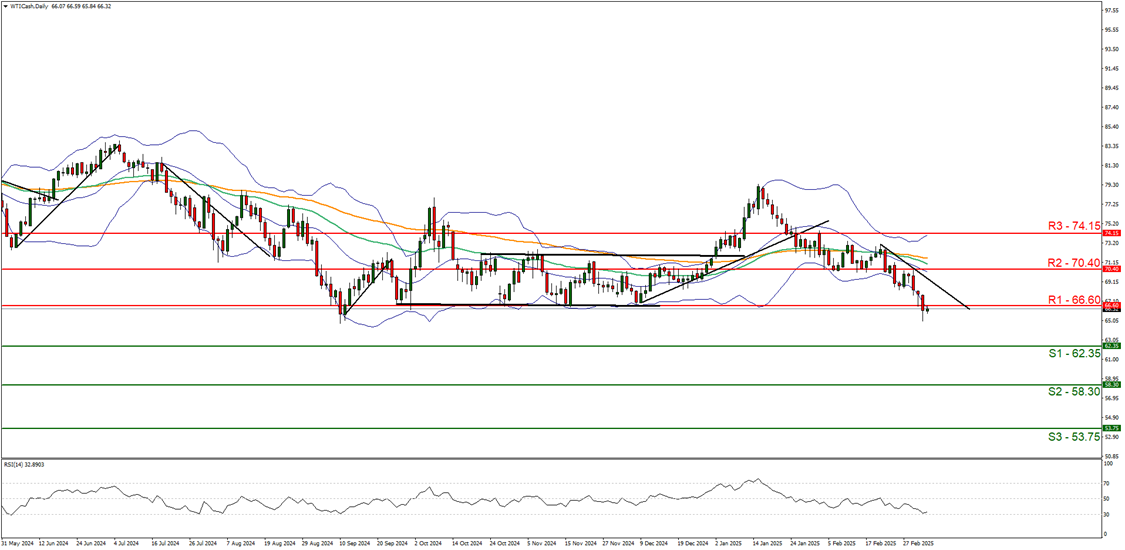
Support: 62.35 (S1), 58.30 (S2), 53.75 (S3).
-
Resistance: 66.60 (R1), 70.40 (R2), 74.15 (R3).
WTICash appears to have moved lower since our last report, with the commodity’s price having cleared our support and now turned to resistance at the 66.60 (R1) level. We opt for a bearish outlook for the commodity’s price and supporting our case is the RSI indicator below our chart which currently registers a figure near 30, implying a strong bearish market sentiment, in addition to the downwards moving trendline which was incepted on the 20th of February. For our bearish outlook to continue, we would require a break below the 62.35 (S1) support level, with the next possible target for the bears being the 58.30 (S2) support level. On the flip side, for a bullish outlook, we would require a clear break above the 66.60 (R1) resistance line, with the next possible target for the bulls being the 70.40 (R2) resistance level. Lastly, for a sideways bias we would require the commodity’s price to remain confined between the 62.35 (S1) support level and the 66.60 (R1) resistance line.
Author

Phaedros Pantelides
IronFX
Mr Pantelides has graduated from the University of Reading with a degree in BSc Business Economics, where he discovered his passion for trading and analyzing global geopolitics.


