Oil outlook: Bears continue to dominate Oil prices

Oil prices continued their downward motion over the past week, despite an upward correction on Monday given Trump’s intentions to impose tariffs. Today we are to take a look at the state of the US oil market as well as other fundamental issues affecting the demand and the supply side of the international oil market. For a rounder view, we are to conclude the report with a technical analysis of WTI’s daily chart.
Slack in the US Oil market weighs on Oil prices
We make a start with the situation of the US oil market. On Friday, the release of the US Baker Hughes total rig count, showed that the number of active oil rigs, unexpectedly rose to 479, if compared with the indicator’s last reading of 472. The release tended to show some bullish signals for oil prices as it could imply that demand was on the rise thus forced oil producers to activate more oil rigs. Yet the idea of a tightening US oil market was contradicted on Tuesday as the API weekly crude oil inventories figure showed an increase of 5.025 million barrels, a figure even higher than the increase reported in the last report of 2.860 million barrels. The release highlighted how aggregated oil production surpassed oil demand levels even further, implying a slack in the US oil market over the past week. A similar picture was shown also by the release of the weekly EIA crude oil inventories which showed an even wider increase of oil reserves in the US, namely of 8.664 million barrels a figure that was also wider than the previous week’s increase of 3.463 million barrels. At this point it should be noted that the analysts highlighted the maintenance of oil refineries as one of the main reasons behind the increase of US oil inventories over the past week. Nevertheless we see the case for the easing of the US oil market to have played a role in the drop of oil prices, and should we see the US oil market maintaining a slack in the coming week, we may see it weighing on oil prices.
Consequences of Trump’s tariffs
On Monday, the US government avoided at the last minute to impose tariffs on US imports from Mexico and Canada, by postponing it. The postponement is to last for 30 days and tended to ease market worries somewhat. The importance of the issue relies on the fact that Mexico and Canada are providing the US with oil. Yet an additional tariff of 10% was imposed across all Chinese imports in the US, which are now in effect. The Chinese replied practically immediately, by imposing tariffs of 15% on U.S. coal and LNG and 10% for crude oil, farm equipment and some autos according to Reuters. The Chinese tariffs are to come into effect on the 10th of February. Once the tariffs have been imposed the price of US oil would increase for clients in China, thus its only natural to assume that the Chinese importers may turn to alternative sources thus slowing down US oil exports to China. Such a scenario could weigh on oil prices as domestic refineries may require a discount to absorb the amount of oil intended for exports to China. On a deeper fundamental level, tariffs from the US could slow down economic activity and thus have a bearish effect on oil prices, however that may prove to be more long-term.
Bullish signals from OPEC+
In our comment about OPEC we make a start with the decision of the Joint ministerial monitoring committee meeting on Monday, at which the member states reaffirmed the production levels decided in the December meeting. That would mean that speeding up the increase of oil production levels is not in the organisations plans, trying to keep a relative tightness in the international oil market. At the same time, OPEC oil production declined in January, primarily due to lower output from Iran and Nigeria. Also please note that Saudi Arabia's state oil company raised its March crude prices sharply in a sign of increased tightness in the international oil market. Meanwhile Iran which saw its output dropping and is about to take over the rotating presidency of the OPEC called for OPEC member to show a united front against threats of US President Trump, who restored the "maximum pressure” campaign on Iran with the aim to drive its oil exports to zero. Overall we see bullish signals coming out of OPEC and should they intensify over the coming week, we may see oil prices getting some support.
Technical analysis
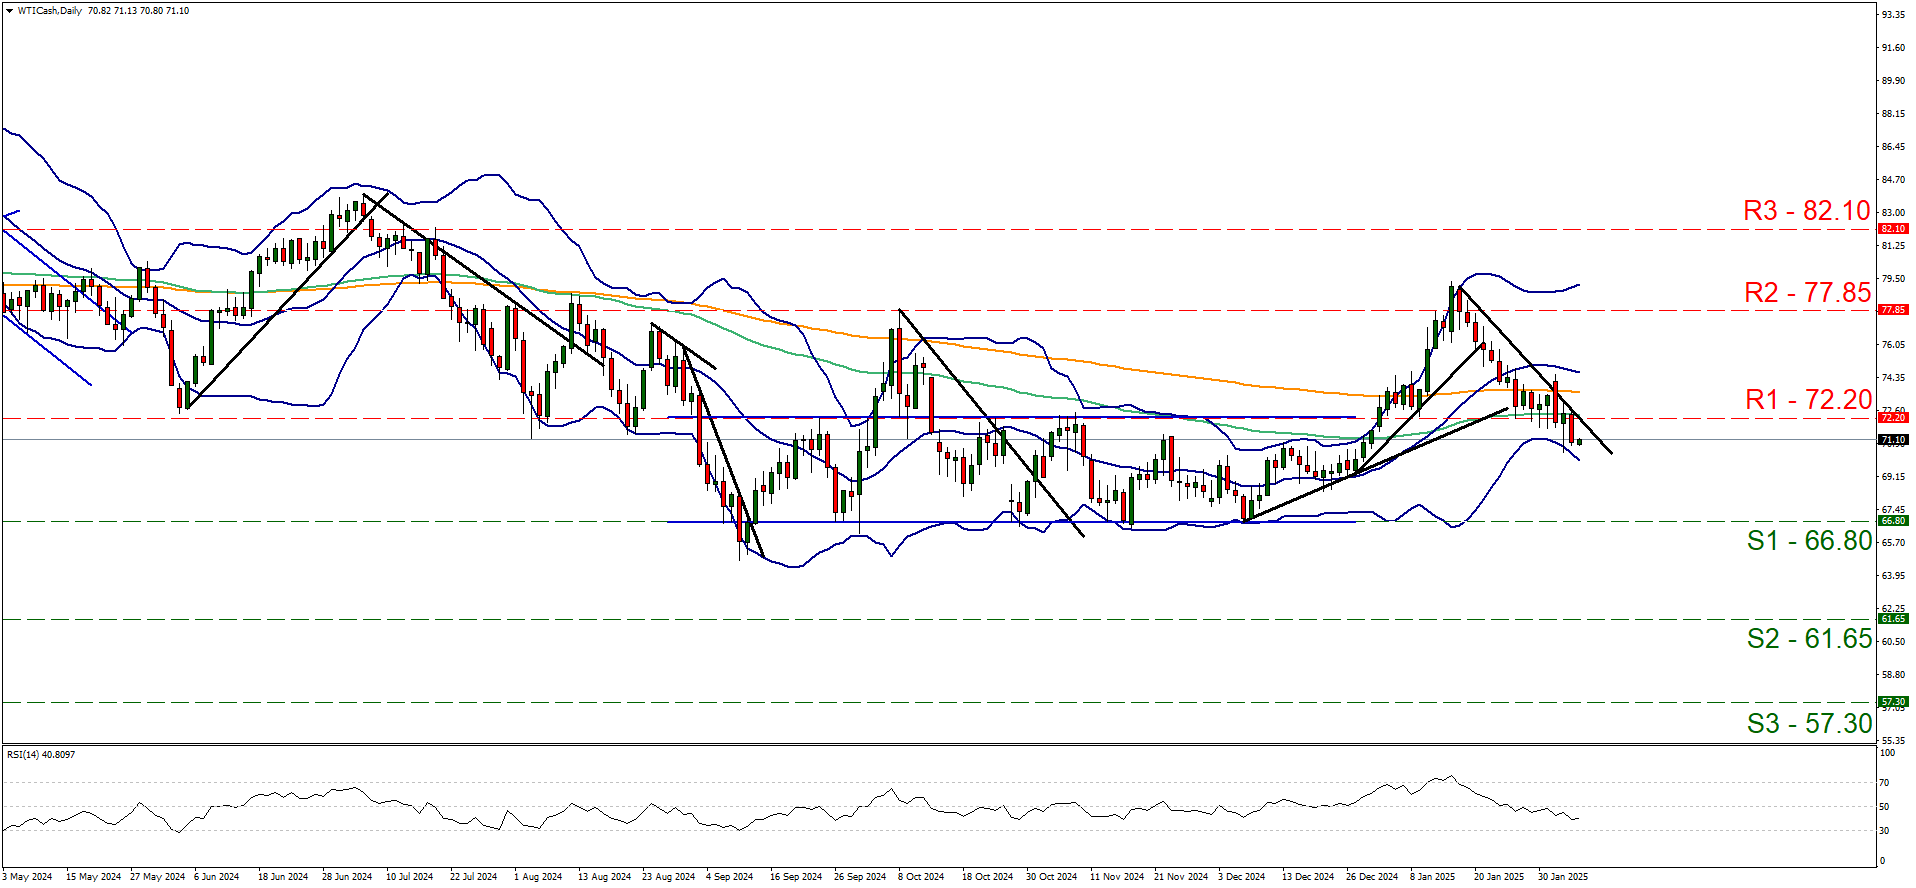
WTI Cash daily chart
Support: 66.80 (S1), 61.65 (S2), 57.30 (S3).
Resistance: 72.20 (R1), 77.85 (R2), 82.10 (R3).
WTI’s downward motion was maintain as it continued edging lower yesterday and despite a correction higher during today’s Asian and early European session. Given that the downward trendline guiding the commodity’s price lower continues to lead WTI’s price, despite a hick up on Monday, we maintain our bearish outlook for WTI at the current stage. We also note that the RSI indicator which maintained its downward motion breaking nearing the reading of 30, implying the intensification of the bearish sentiment among market participants for WTI’s price, which in turn may allow for the downward motion to be continued. Should the bears maintain control over the WTI’s price, we may see it breaking the 66.80 (S1) support line and start aiming for the 61.65 (S2) support level. A bullish outlook seems currently remote and for its adoption we would require WTI’s price action to reverse direction, by breaking the prementioned downward trendline, in a first signal that the downward motion has been interrupted, breaking the 72.20 (R1) resistance line and continue to break the 77.85 (R2) resistance base.
Author

Peter Iosif, ACA, MBA
IronFX
Mr. Iosif joined IronFX in 2017 as part of the sales force. His high level of competence and expertise enabled him to climb up the company ladder quickly and move to the IronFX Strategy team as a Research Analyst. Mr.


