Oil market under pressure: Rising supply, falling demand, and inventory woes

Oil prices dropped 2% last Friday 7 Sept 2024, capping a significant weekly loss as weaker-than-expected U.S. jobs data for August overshadowed support from delayed OPEC+ supply increases. (Source: Reuters)
A rise in inventory may lead manufacturers to reduce production, possibly shuttling plants and/or furloughing workers, worsening the ongoing economic slowdown, according to Nikkei. Their report tracked 12 manufacturing sectors, all showing inventory growth, with electronics, automobiles, and machinery accounting for over 60% of the total increase.
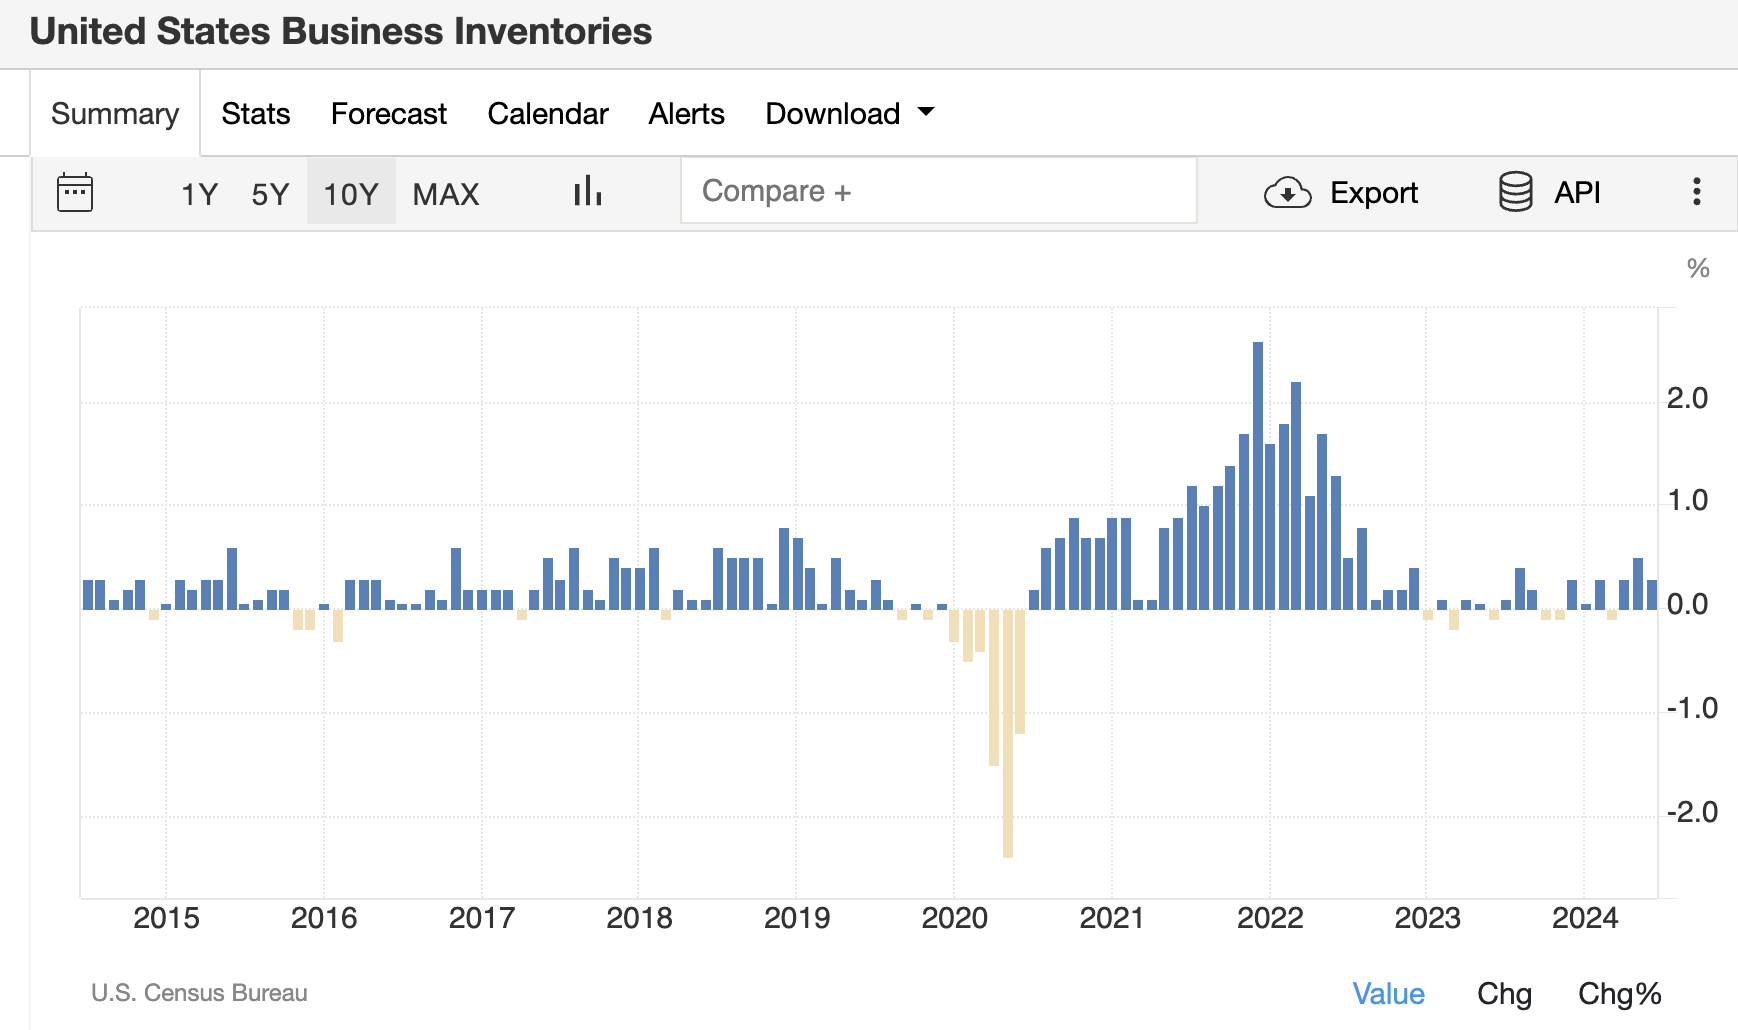
Source: Tradingeconomics
Rising inventory will lower the manufacturing PMI, a key indicator of business conditions that helps analysts predict trends in GDP, industrial production, employment, and inflation. Since PMI data is often released months before official figures, it is considered one of the most influential economic reports. (Source: S&P Global).
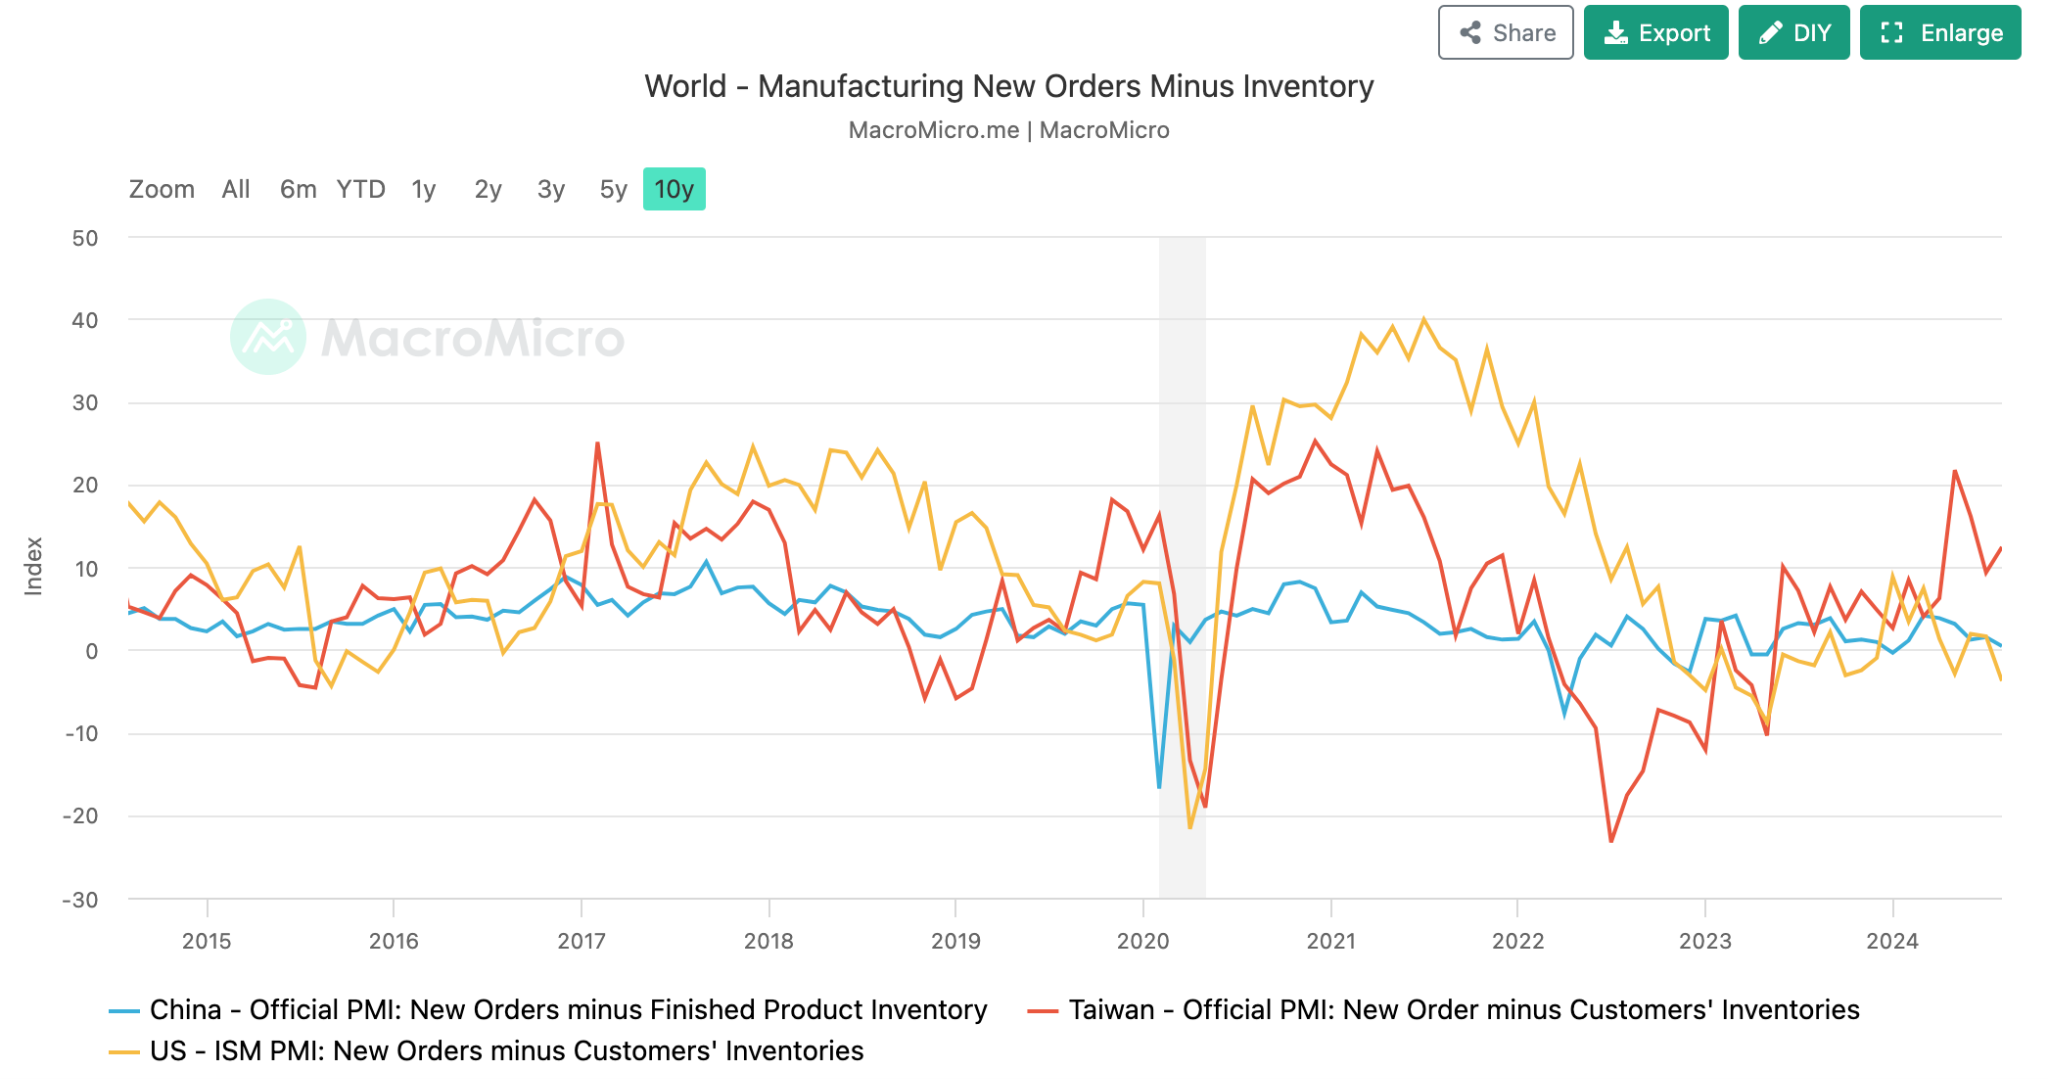
Source: MacroMicro
New orders minus inventory are falling in both the US and China, indicating a short-term economic slowdown and reduced oil demand. Additionally, declining petrol car sales and the rise of energy-efficient vehicles further decrease oil demand.
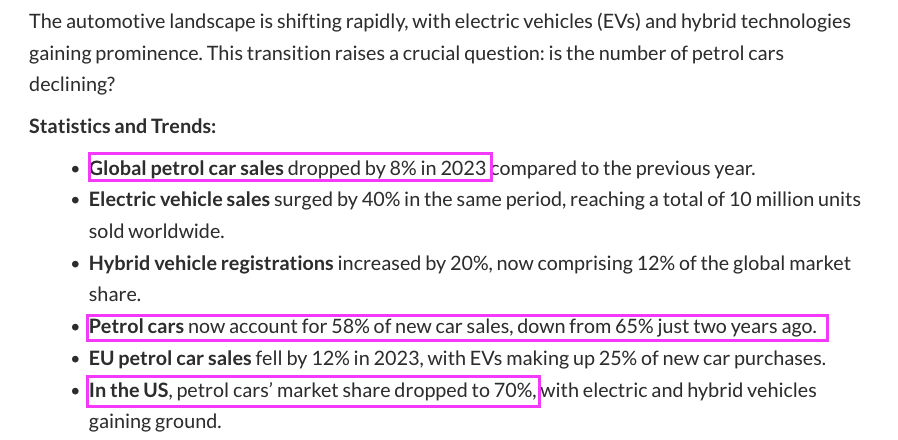
Source: techdriveplay
Global oil supply grew by 910 kb/d in 2Q24, led by the US, and is expected to rise by 770 kb/d in 3Q24, mainly from non-OPEC+ sources. Supply growth for 2024 is forecast at 770 kb/d, reaching 103 mb/d. US production has offset OPEC cuts. Increased supply and reduced demand are likely to lower oil prices.
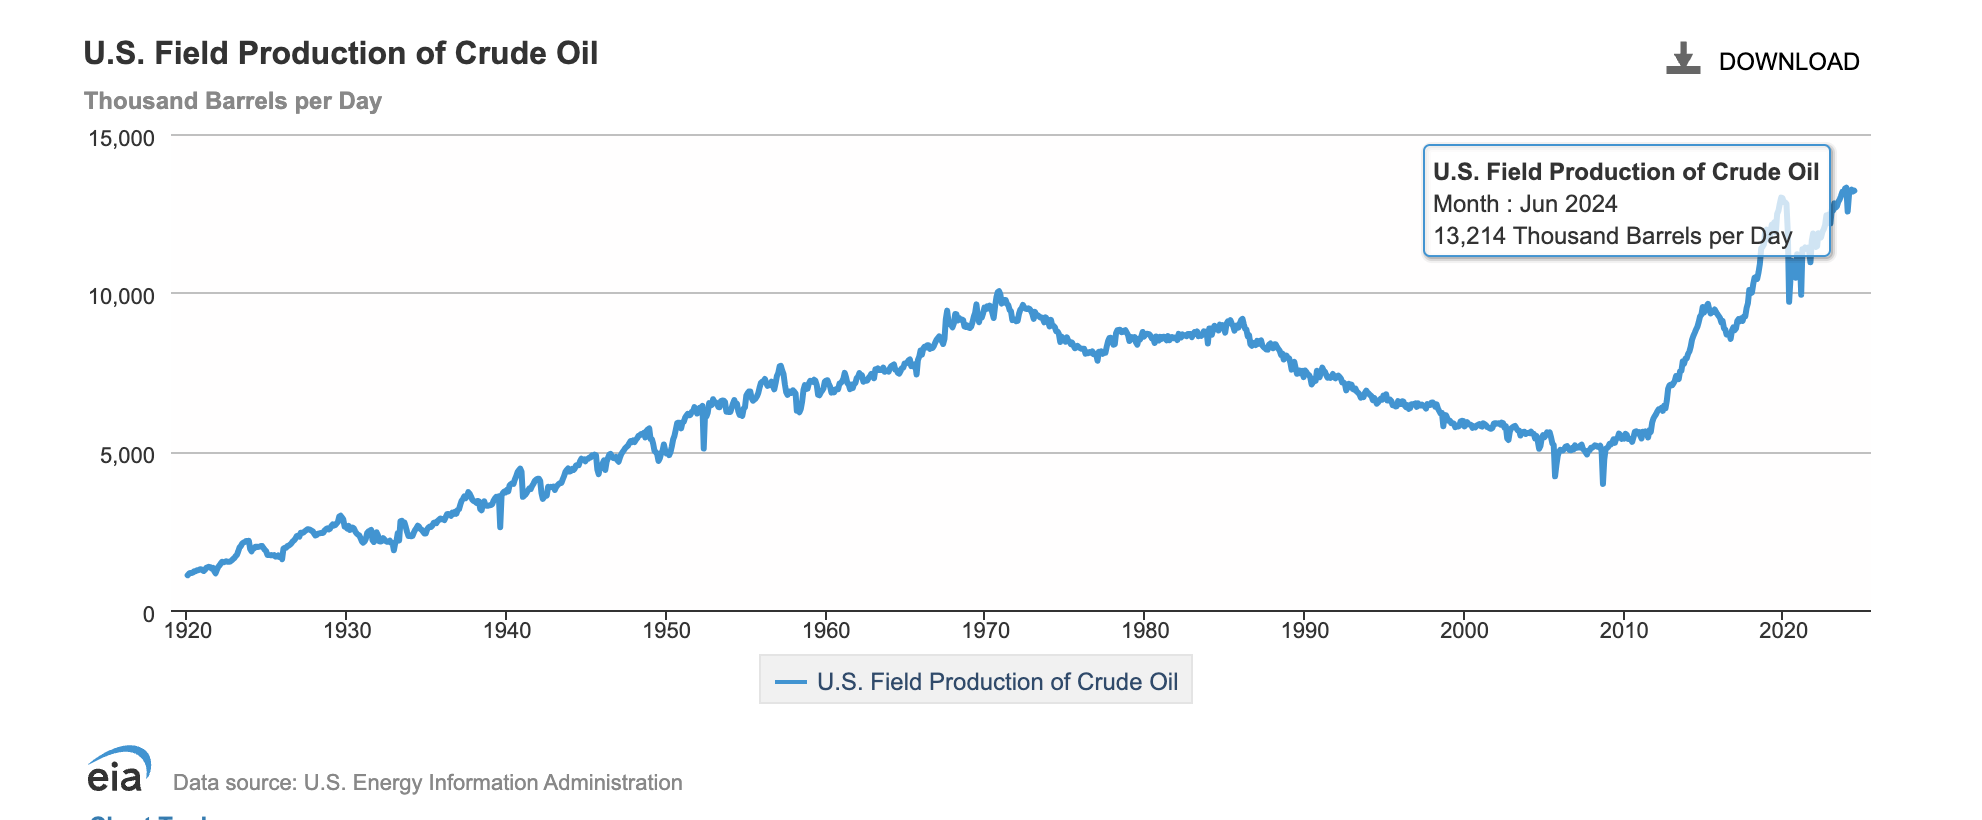
Source: EIA
Market oil supply also increases from inventory fluctuations release of the oil. Inventory typically hits a low in September and October, rebounds in November, and drops again in December. A decrease in inventory adds to market oil supply.
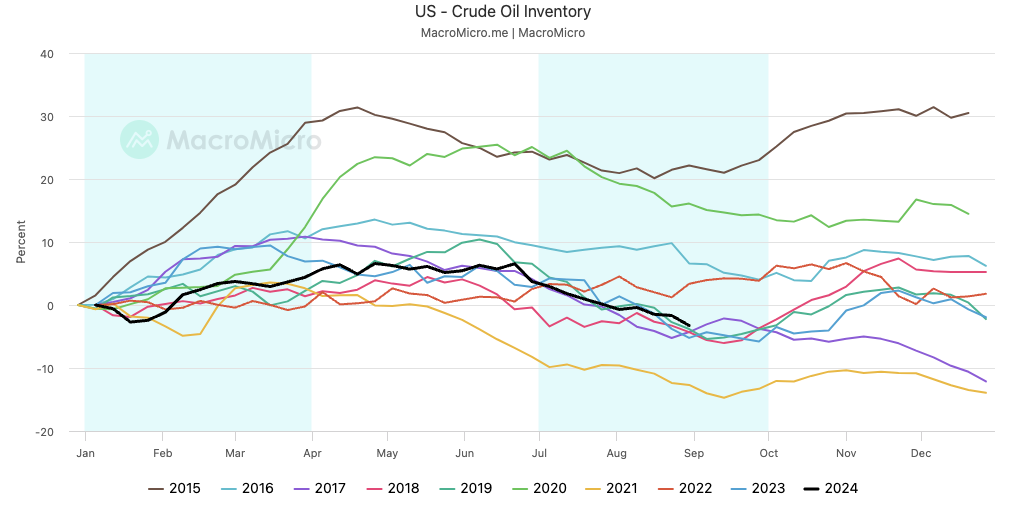
Source: MacroMicro
Cyclel analysis
Cycle analysis shows oil prices tend toprovide higher frequency of negative returns in October and November, with a more balanced performance in December.
From 1990-2023, the performance of WTI in Oct, Nov and Dec.
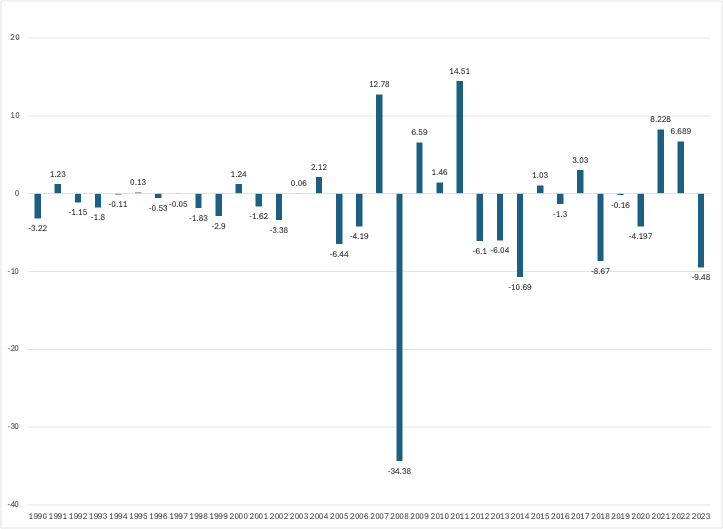
OCT
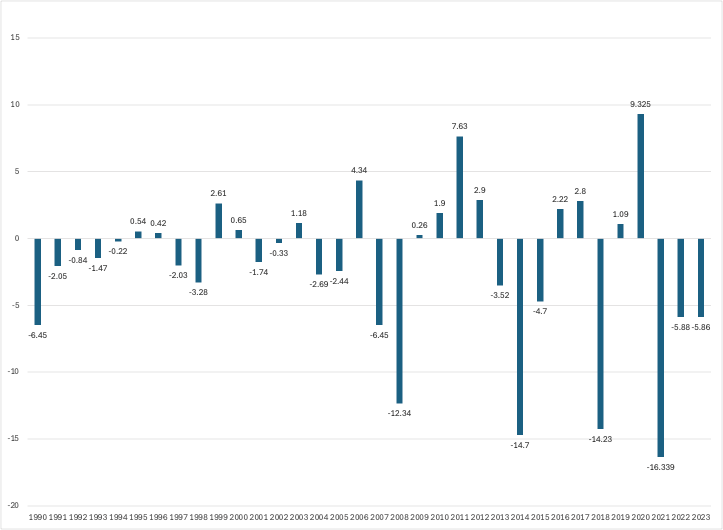
NOV
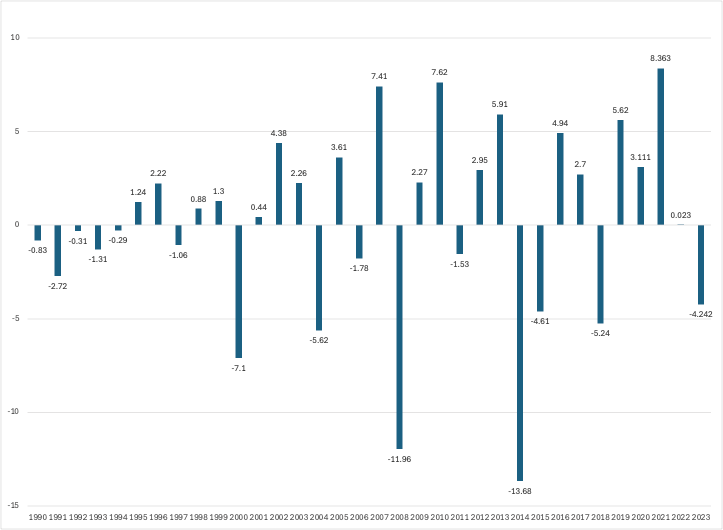
DEC
Source: Adopted from Reuters
Technical analysis
The weekly oil chart shows sideways movement after sharp fluctuations. The daily chart indicates support around 60-62, with stochastic in the oversold zone in short-term. A more major technical support should be found at 42.
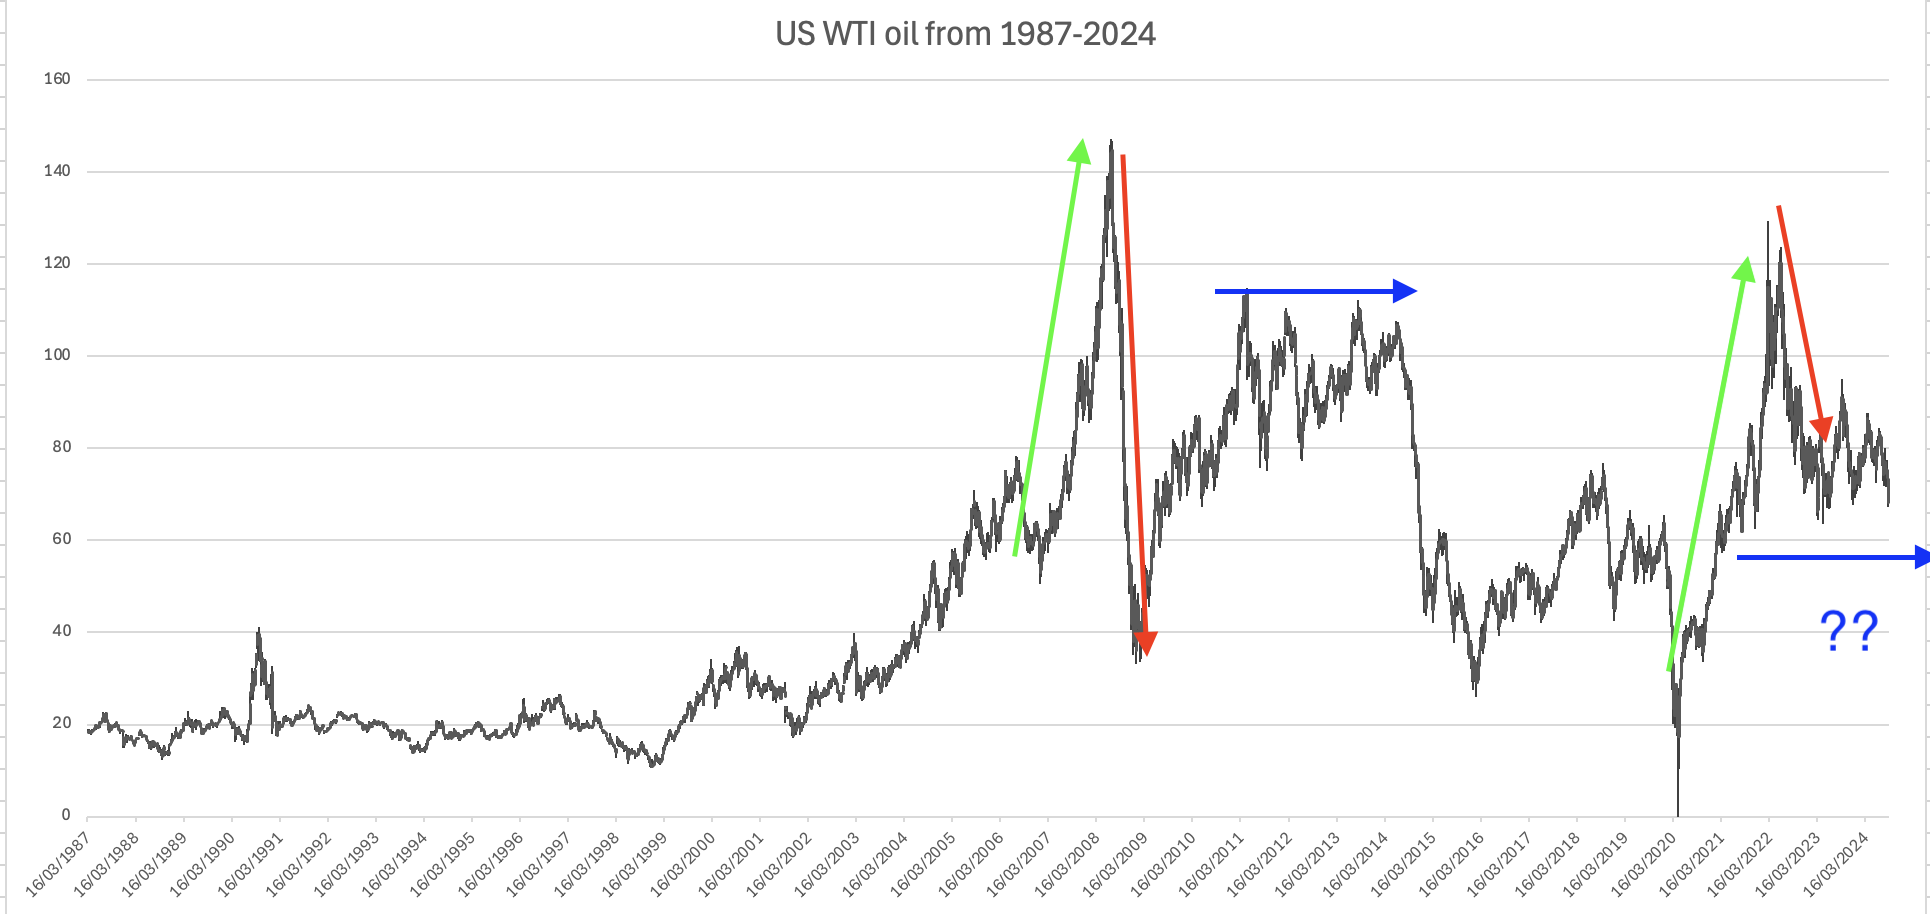
Source: Adopted from Reuters
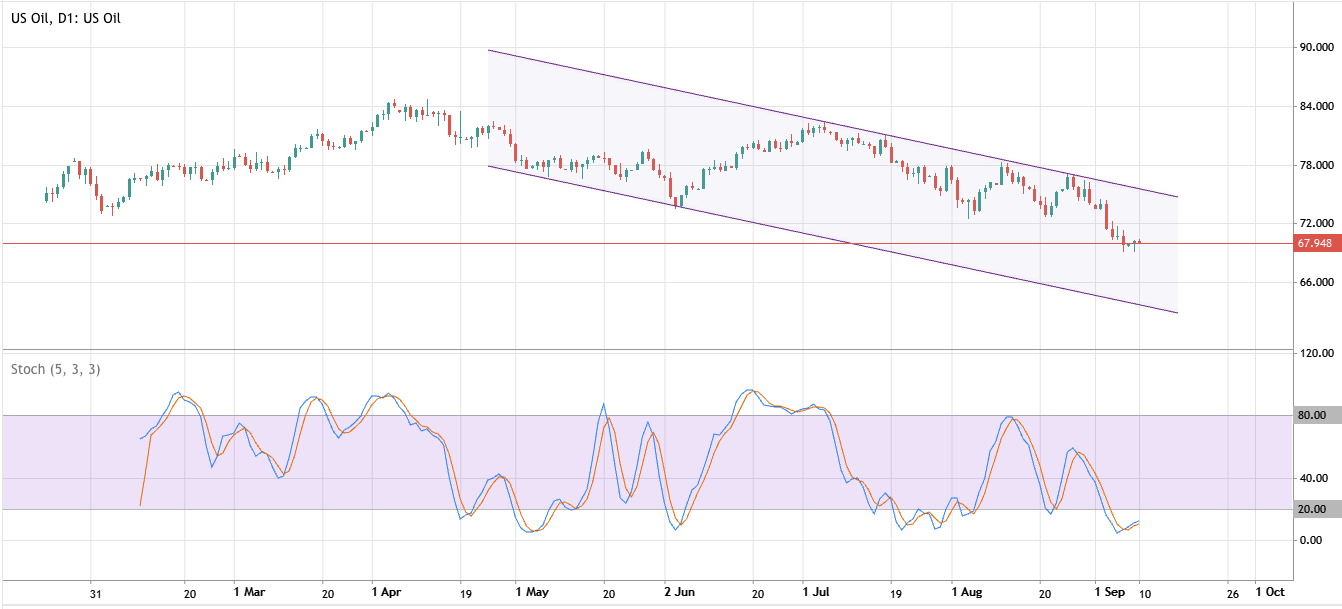
Source: Deriv MT5
Conclusion
Oil supply is rising while demand falls due to manufacturing slowdown and increased energy-efficient vehicle use, likely putting downward pressure on prices in the coming months. Seasonal trends indicate further weakness in October and November, with a possible rebound in December as inventories adjust.
Author

Prakash Bhudia
Deriv
Prakash Bhudia, HOD – Product & Growth at Deriv, provides strategic leadership across crucial trading functions, including operations, risk management, and main marketing channels.


