Oil Elliott Wave technical forecast [Video]
![Oil Elliott Wave technical forecast [Video]](https://editorial.fxstreet.com/images/Markets/Commodities/Energy/Oil/oil-flows-out-of-barrel-20436219_XtraLarge.jpg)
WTI Elliott Wave analysis
Function - Counter-trend.
Mode - Corrective.
Structure - Zigzag.
Position - Wave (b) of ‘y’.
Direction - Wave (c) of ‘y’.
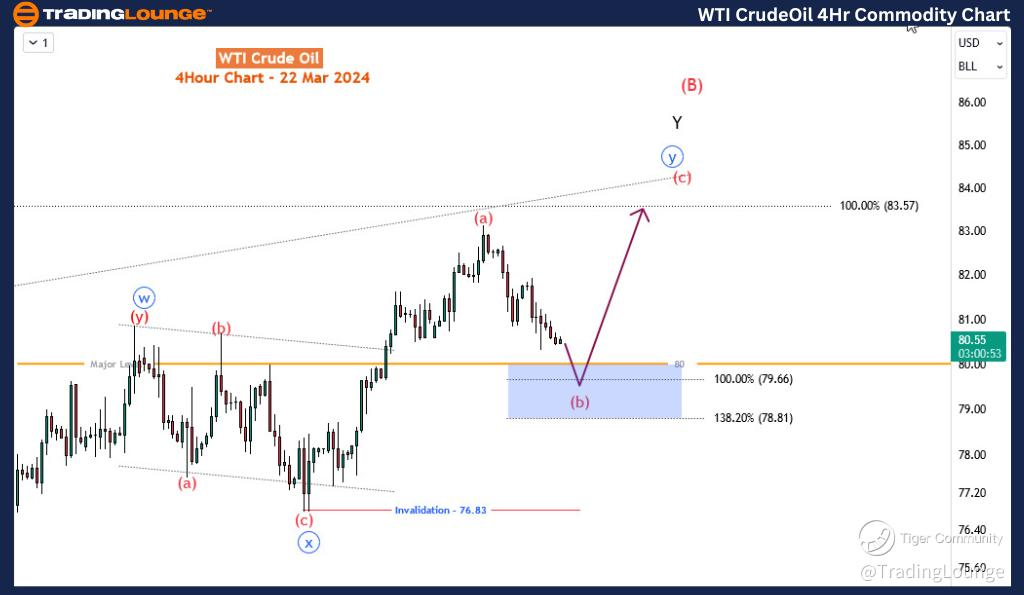
Details - A pullback for (b) is now close to the 80 major level. A rebound is expected from the marked zone (80-78.8) for wave (c) toward 83.
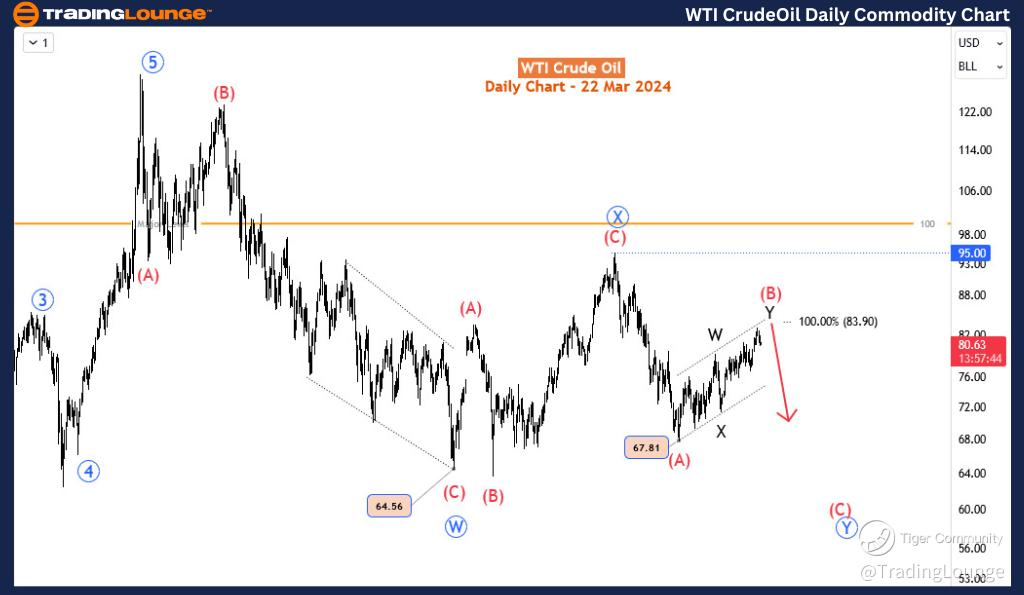
Since December 2013, WTI has gained over 18%, which marks a decent recovery following the 28% slump from September to December 2023. However, this recovery only constitutes about 60% of the slump and is corrective. We anticipate that once the correction concludes, the slump from September 2023 will likely resume and possibly extend below $65. In such a scenario, oil would have shed half or more of its value since its peak at $130.5 in March 2022. The Elliott Wave principle can provide insights into whether this recovery has concluded, considering the broader context since March 2022.
On the daily timeframe, the oil market resides within a long-term corrective phase of the bullish trend that commenced in March 2022 following the remarkable rebound from the Covid-induced downturn. This corrective phase exhibits bearish characteristics and appears to be forming a double zigzag pattern from $130.55. The initial leg of the zigzag, denoted as wave W (encircled in blue), concluded in March 2023, followed by a resurgence for the corresponding wave X (also encircled in blue), which completed around $95 in September 2023. Subsequently, another three-wave decline for wave Y (blue-circled) is currently unfolding. Sub-wave (A) terminated just below $68 in December 2023, leading to the ongoing rebound for sub-wave (B). This wave (B) is also shaping as a double zigzag and is nearing the conclusion of its 3rd leg - wave Y.
On the H4 timeframe, we presently find ourselves within wave (b) of y of Y of (B) - the waves preceding the final leg. Wave (b) is approaching a crucial major level at 80, or the 80-78.8 zone just below it. We anticipate this level or zone to provide support for (b). Subsequently, wave (c) is expected to initiate shortly, targeting prices above $84. However, (b) may deviate lower than anticipated or potentially fail to reach the key zone, yet it should ideally remain above 76.83. A breach below 76.83 could signify that (B) has already concluded, and the bullish correction from December 12 might have peaked between $83.1
Oil Elliott Wave technical forecast [Video]
Author

Peter Mathers
TradingLounge
Peter Mathers started actively trading in 1982. He began his career at Hoei and Shoin, a Japanese futures trading company.


