|

Oil Elliott Wave Analysis: Larger Correction Taking Place?

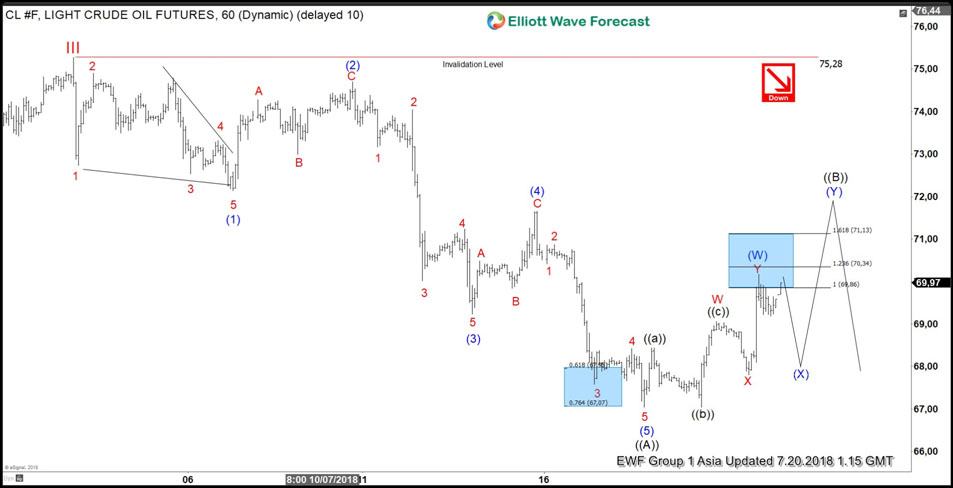
OIL short-term Elliott wave analysis suggests that the rally to $75.28 high ended cycle degree wave III. Down from there, the larger correction in cycle degree wave IV is taking place in 3, 7 or 11 swings before Oil resumes higher. The internal of the first leg of the decline from $75.28 high took place in 5 waves impulse with internal distribution of 5 waves structure in lesser degree cycle. This suggests that the five waves down from $75.27 is part of a larger Elliott wave Zigzag correction within cycle degree wave IV pullback.

Down from $75.28 high, the decline to $72.14 low ended intermediate wave (1) as a leading diagonal structure. Above from there, the bounce to 74.70 high ended intermediate wave (2) bounce as a Zigzag correction. Below from there, the decline to $69.23 low ended intermediate wave (3) in another 5 waves. Then the bounce to $71.66 high ended intermediate wave (4) bounce in 3 swings. The final decline from there unfolded in 5 waves structure which ended intermediate wave (5) at $67.04 low & also completed the primary wave ((A)).

Up from there, the instrument is doing the primary wave ((B)) recovery against 7/03 high ($75.28) in 3, 7 or 11 swings before further decline is seen. So far instrument already made the 3 waves recovery & reached the $69.86 – $70.34 100%-123.6% Fibonacci extension area of Minor W-X to complete intermediate wave (W). The instrument is expected to do a 3 waves pullback in intermediate wave (X) then another leg higher in intermediate wave (Y) of ((B)) can be seen before instrument resumes lower again. We don’t like selling it.

OIL 1 Hour Elliott Wave Chart

Oil
Chart


Become a Successful Trader and Master Elliott Wave like a Pro. Start your Free 14 Day Trial at - Elliott Wave Forecast.

Author

Elliott Wave Forecast Team

Elliott Wave Forecast Team

ElliottWave-Forecast.com

More from Elliott Wave Forecast Team
Share:

Editor's Picks

EUR/USD hits two-day highs near 1.1820

EUR/USD picks up pace and reaches two-day tops around 1.1820 at the end of the week. The pair’s move higher comes on the back of renewed weakness in the US Dollar amid growing talk that the Fed could deliver an interest rate cut as early as March. On the docket, the flash US Consumer Sentiment improves to 57.3 in February.

GBP/USD reclaims 1.3600 and above

GBP/USD reverses two straight days of losses, surpassing the key 1.3600 yardstick on Friday. Cable’s rebound comes as the Greenback slips away from two-week highs in response to some profit-taking mood and speculation of Fed rate cuts. In addition, hawkish comments from the BoE’s Pill are also collaborating with the quid’s improvement.

Gold climbs further, focus is back to 45,000

Gold regains upside traction and surpasses the $4,900 mark per troy ounce at the end of the week, shifting its attention to the critical $5,000 region. The move reflects a shift in risk sentiment, driving flows back towards traditional safe haven assets and supporting the yellow metal.

Crypto Today: Bitcoin, Ethereum, XRP rebound amid risk-off, $2.6 billion liquidation wave

Bitcoin edges up above $65,000 at the time of writing on Friday, as dust from the recent macro-triggered sell-off settles. The leading altcoin, Ethereum, hovers above $1,900, but resistance at $2,000 caps the upside. Meanwhile, Ripple has recorded the largest intraday jump among the three assets, up over 10% to $1.35.

Three scenarios for Japanese Yen ahead of snap election

The latest polls point to a dominant win for the ruling bloc at the upcoming Japanese snap election. The larger Sanae Takaichi’s mandate, the more investors fear faster implementation of tax cuts and spending plans. 

XRP rally extends as modest ETF inflows support recovery

Ripple is accelerating its recovery, trading above $1.36 at the time of writing on Friday, as investors adjust their positions following a turbulent week in the broader crypto market. The remittance token is up over 21% from its intraday low of $1.12.