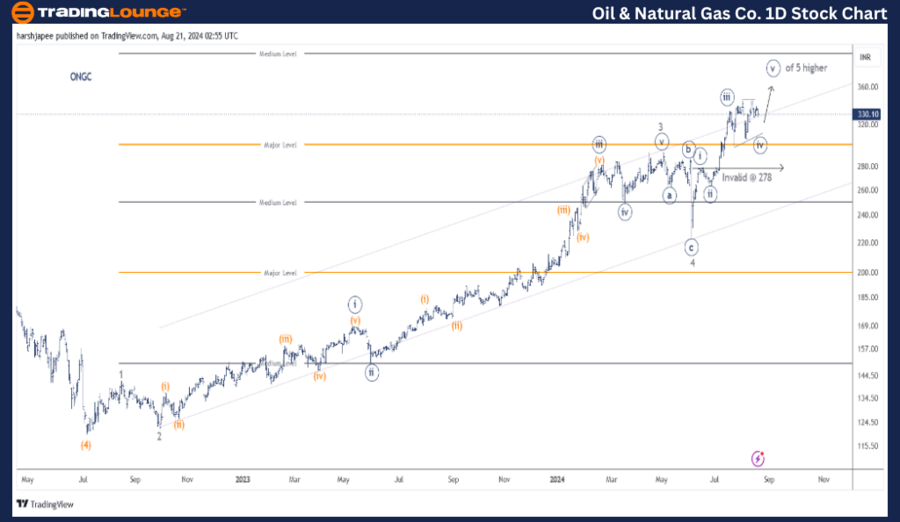
Oil and Natural Gas CO – ONGC (1D chart) Elliott Wave/technical analysis
Function: Larger Trend Higher (Intermediate degree Wave (5), orange).
Mode: Motive.
Structure: Impulse.
Position: Minute Wave ((iv)).
Details: Minute Wave ((iv)) Navy, is nearing completion or is complete as triangle. If correct, Minute Wave ((v)) should resume higher soon.
Invalidation point: 278.
ONGC Daily Chart Technical Analysis and potential Elliott Wave Counts:
ONGC daily chart potential wave counts since July 22 is indicating an Intermediate Wave (5) Orange is nearing completion as prices are progressing within Minute Wave ((v)) Navy against 278 mark. If the above holds well, prices should turn higher from here or the 310-20 range in the near term.
The stock has rallied from its July 2022 low registered at the 120 mark, also Intermediate Wave (4) termination. Minor Wave 3 was extended and Minor Wave 4 has been marked complete at 222 registered on June 04, 2022.
Since then, Minor Wave 5 has been unfolding and is potentially terminating Minute Wave ((iv)) as a triangle around 310-20 range. If the above is correct, the final thrust Wave ((v)) Navy should resume from here and extend through 400 mark.
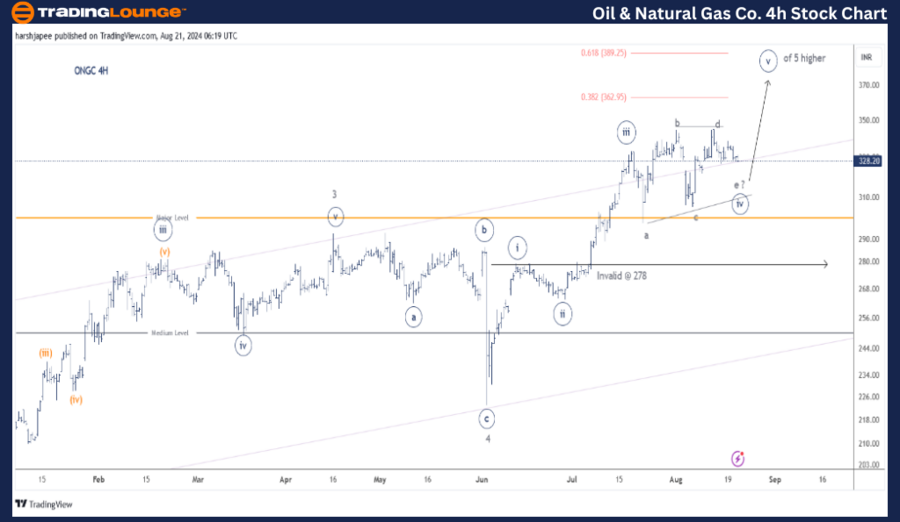
Oil and Natural Gas CO – ONGC (4H chart) Elliott Wave/technical analysis
Function: Larger Trend Higher (Intermediate degree Wave (5), orange).
Mode: Motive.
Structure: Impulse.
Position: Minute Wave ((iv)).
Details: Minute Wave ((v)) Navy to resume soon within Minor Wave 5 of Intermediate Wave (5) Orange.
Invalidation point: 278.
ONGC 4H Chart Technical Analysis and potential Elliott Wave Counts:
ONGC 4H chart is indicating the progressive structure of Minor Wave 5 Grey within Intermediate Wave (5) Orange against the 222 low since June 04. Price should ideally hold above 278, Minute Wave ((i)) Navy, to maintain the Impulse.
The stock has potentially terminated Minutes Waves ((i)) through ((iv)) Navy and should resume its Wave ((v)) rally towards 390-400 zone as projected here. Minute Wave ((iv)) is unfolding as triangle and sub Minuette wave e seems to be near completion.
Conclusion
ONGC is expected to resume its final thrust Minute Wave ((v)) Navy towards 390-400 range, within Minor Wave 5 of Intermediate Wave (5) Orange.
Technical analyst: Harsh Japee.
Oil and Natural Gas CO – ONGC Elliott Wave/technical analysis [Video]
As with any investment opportunity there is a risk of making losses on investments that Trading Lounge expresses opinions on.
Historical results are no guarantee of future returns. Some investments are inherently riskier than others. At worst, you could lose your entire investment. TradingLounge™ uses a range of technical analysis tools, software and basic fundamental analysis as well as economic forecasts aimed at minimizing the potential for loss.
The advice we provide through our TradingLounge™ websites and our TradingLounge™ Membership has been prepared without considering your objectives, financial situation or needs. Reliance on such advice, information or data is at your own risk. The decision to trade and the method of trading is for you alone to decide. This information is of a general nature only, so you should, before acting upon any of the information or advice provided by us, consider the appropriateness of the advice considering your own objectives, financial situation or needs. Therefore, you should consult your financial advisor or accountant to determine whether trading in securities and derivatives products is appropriate for you considering your financial circumstances.
Recommended Content
Editors’ Picks

AUD/USD drops to 0.6350 as markets turn cautious on trade uncertainty
AUD/USD is falling back toward 0.6350 in Thursday's Asian trading amid fading optimism over a quick resolution to the US-China trade dispute. Meanwhile, a renewed US Dollar selling on looming trade uncertainty, concerning US, China and Japan could limit the pair's downside.

USD/JPY tumbles toward 142.50 amid US-Japan trade talks
USD/JPY closes in on 142.50, correcting sharply from over a one-week top set on Wednesday. Uncertainty over the US-Japan trade talks and the divergent BoJ-Fed policy expectations continue to offer a double-whammy to the pair amid a fresh bout of US Dollar selling.

Gold price bounces back above $3,350 on fading US-China trade deal optimism
Gold price regains positive traction abpve $3,350 in the Asian session on Thursday, snapping a two-day losing streak to the $3,260 area, or the weekly low touched the previous day. The optimism over a possible US-China trade deal fades quickly and revives demand for the safe-haven bullion.

Ethereum ETF sees boost as bulls target descending channel resistance
Ethereum gained 2% on Wednesday after US spot Ether ETFs recorded their largest inflows since February 4. However, the top altcoin could face a correction after experiencing a rejection at its 50-day Simple Moving Average.

Five fundamentals for the week: Traders confront the trade war, important surveys, key Fed speech Premium
Will the US strike a trade deal with Japan? That would be positive progress. However, recent developments are not that positive, and there's only one certainty: headlines will dominate markets. Fresh US economic data is also of interest.

The Best brokers to trade EUR/USD
SPONSORED Discover the top brokers for trading EUR/USD in 2025. Our list features brokers with competitive spreads, fast execution, and powerful platforms. Whether you're a beginner or an expert, find the right partner to navigate the dynamic Forex market.