NZD/USD prepares to switch to a bull market [Video]
-
NZDUSD prints bullish trend pattern.
-
Constraining 50-day SMA under examination again.
-
FOMC meeting minutes due for release at 19:00 GMT.
![NZD/USD prepares to switch to a bull market [Video]](https://editorial.fxstreet.com/images/Markets/Currencies/Majors/NZDUSD/new-zealand-dollar-closeup-28405768_XtraLarge.jpg)
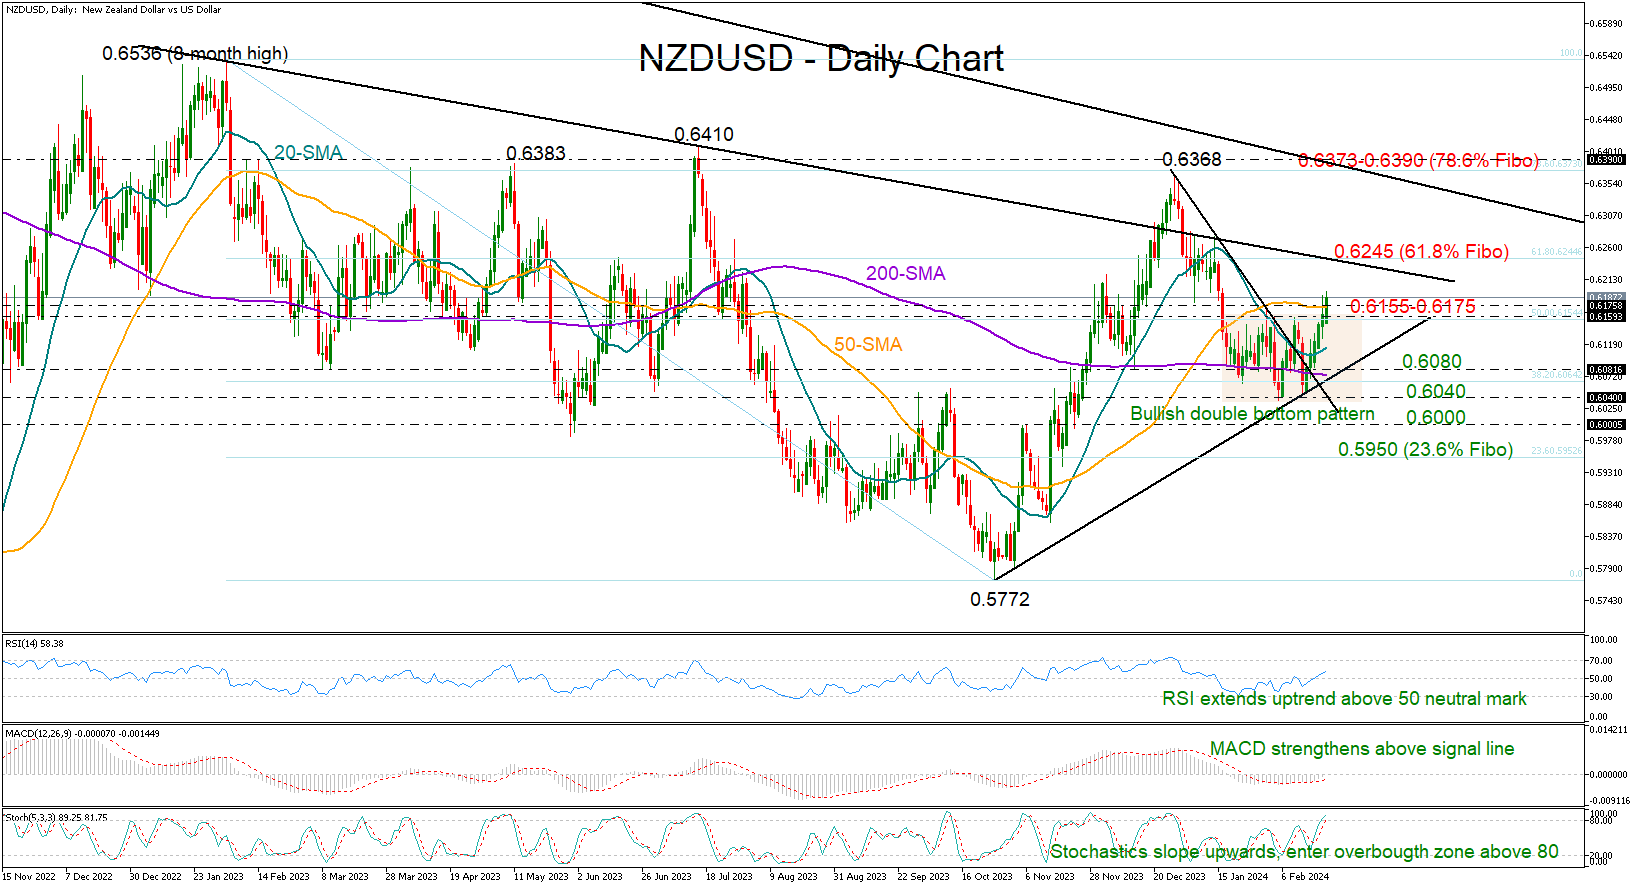
NZDUSD is looking to complete a bullish double bottom pattern above the 0.6155 neckline and the 50% Fibonacci retracement of the February-October 2023 downtrend.
Technically, the bulls could dominate in the coming sessions as the RSI has extended its upward pattern above its 50 neutral mark and the MACD continues to strengthen above its red signal line. Meanwhile, the stochastic oscillator has entered the overbought zone above 80, warning that potential price increases might be transitory.
The 50-day simple moving average (SMA), which has been capping upside movements over the past couple of weeks, is currently under the spotlight at 0.6175. A close above it could push the price straight up to the 61.8% Fibonacci mark of 0.6245, while higher, the market could experience a fast rally towards December’s peak of 0.6368 and the 0.6390 barrier.
Should the sellers take over, squeezing the price back below the 50% Fibonacci of 0.6155, support could come somewhere between the 200-day simple moving average (SMA) and the 0.6040 zone. Note that the 38.2% Fibonacci of 0.6064 and the ascending trendline from October’s lows are also within the region. Therefore, a bearish correction at this point might confirm an extension to 0.6000 and then down to the 23.6% Fibonacci of 0.5950.
Summing up, NZDUSD is setting the stage for another bullish round, with traders awaiting another positive close above the 50-day SMA and the 0.6155 territory to confirm a positive trend pattern.
Author

Christina joined the XM investment research department in May 2017. She holds a master degree in Economics and Business from the Erasmus University Rotterdam with a specialization in International economics.


