NZD/USD poised for bullish rotation
-
NZDUSD rotates higher after touching familiar support zone.
-
Technical signals increase the odds for upside reversal.
-
FOMC policy announcement might affect USD at 18:00 GMT.

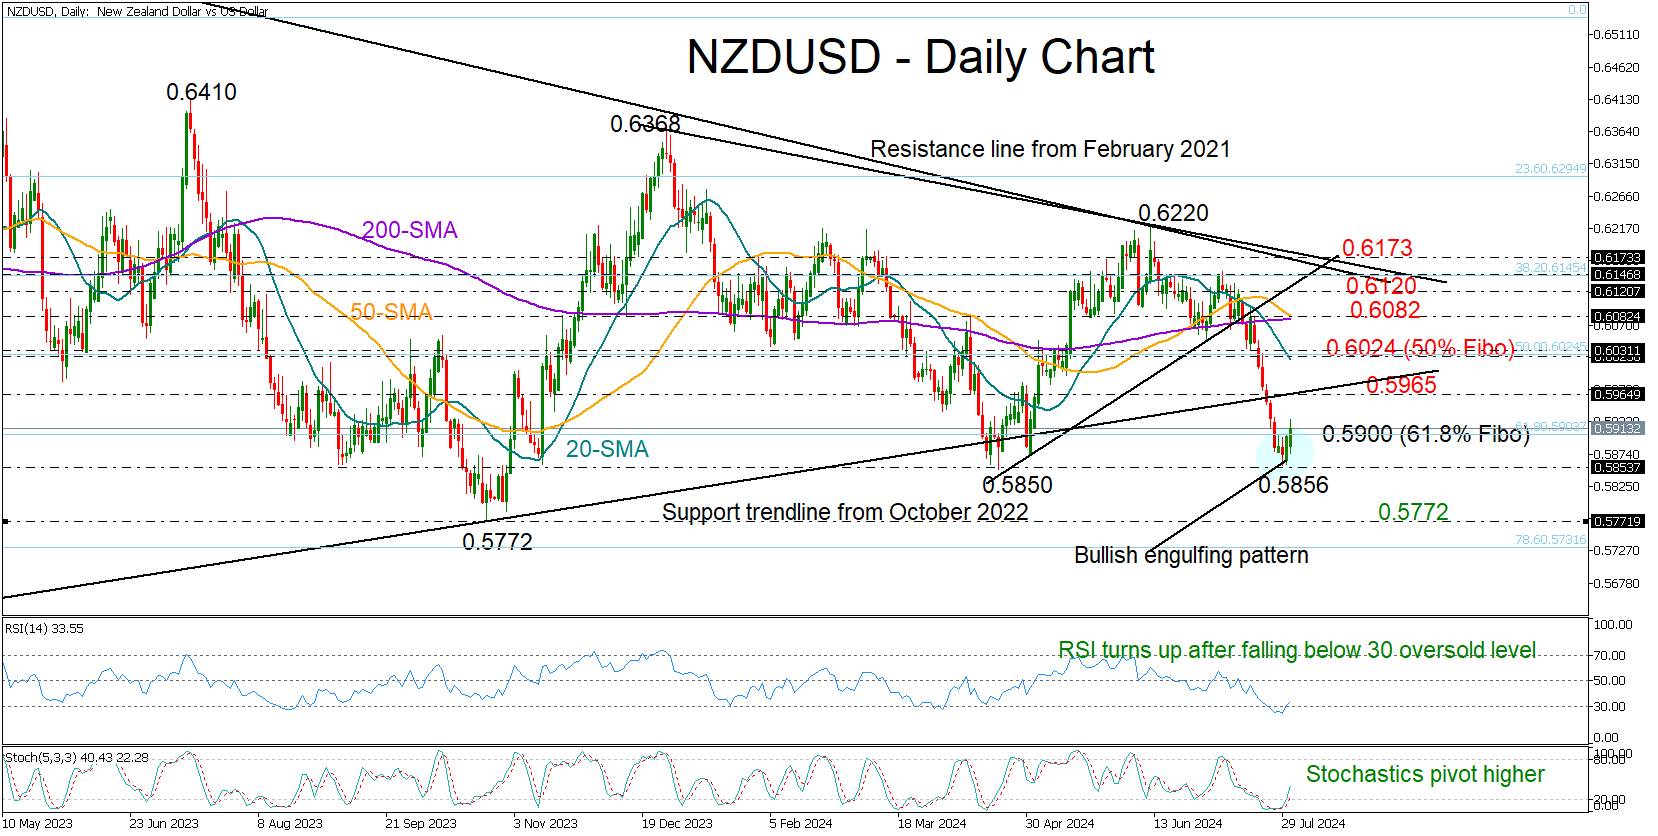
NZDUSD has had a terrible month, but a bullish rotation this week has brought hope that the bearish phase could be over.
The pair changed direction and moved north after reaching April’s pivotal zone of 0.5850, creating a bullish engulfing candlestick pattern. This is usually a sign of a positive reversal, with the RSI and stochastic oscillator endorsing the idea as they are both emerging from oversold territory.
Confirming further gains may require a close above the 61.8% Fibonacci retracement of the October-February 2023 upleg at 0.5900. However, a significant challenge for the bulls could be the 0.5965 area, where the broken support trendline from October 2022 is located. Breaching that bar, the price could rise straight to the 20-day simple moving average (SMA) and the 50% Fibonacci of 0.6024, while higher, a new barrier could emerge somewhere between the 50- and 200-day SMAs at 0.6082.
Still, only a sustainable increase above the resistance zone of 0.6120-0.6173 would brighten the long-term outlook given that the tough 2021 descending trendline, which has been capping bullish actions since the 2021 top, is within the region.
Should the 0.5850 floor crack, the spotlight will fall on the 2023 low of 0.5772. An extension lower would violate the 2023-2024 wide range, likely prompting a sharp decline towards the 0.5590 constraining zone taken from October 2022.
In a nutshell, NZDUSD could potentially embark on a new positive cycle following a significant decline. Yet, traders may need a signal above the level of 0.5965 to drive the pair higher.
Author

Christina joined the XM investment research department in May 2017. She holds a master degree in Economics and Business from the Erasmus University Rotterdam with a specialization in International economics.


