NZD/USD exits 17-months range to find buyers from the dip

From a long-term perspective, NZDUSD completed a Cycle Degree wave I in early February 2023. Following wave I, a wave II pullback is expected in a corrective structure. Since the high of February 2023, the pair completed wave ((W)) of II in late October 2023. We identified this as wave ((W)) rather than wave II because the recovery from October 2023 has been corrective. Therefore, we anticipate that wave II could be forming as a double correction, unless the price breaches the wave I high. This forms our long-term outlook on the weekly chart. We update the daily and weekly charts for our members every weekend.
In the medium term, a recovery for wave (C) of ((X)) began from the low in August 2024. On the H4 and daily charts, we have identified a bullish sequence from the August low, which supports our view for further upside. In such a bullish sequence, we prefer to buy dips in a 3, 7, or 11 swing structure. Accordingly, we advised our members to wait for pullbacks rather than buying at the top. In addition to showing the path on our charts, we also provide members with key zones for potential entries and stop placements. Here’s an example of such guidance shared with members on September 7, 2024.
NZD/USD Elliott Wave analysis – 09.07.2024 four-hour chart
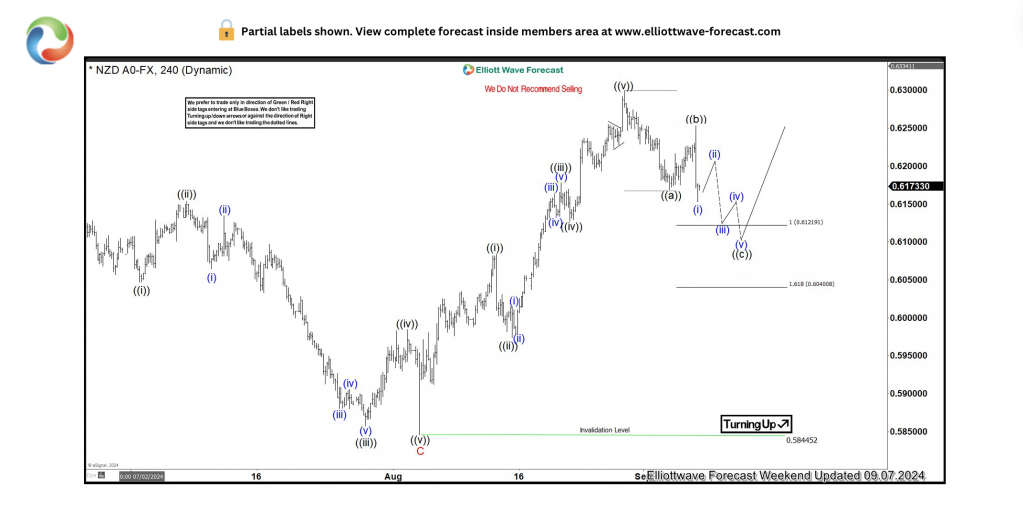
On 9.7.2024, we shared the chart above with our members. After completing a bullish impulse sequence from August 5, 2024, a pullback began. We identified the dip as a 3-swing corrective structure, with an extreme zone between 0.6121 and 0.6040. This suggested that buyers should look for entries around 0.6121, with stops placed just below 0.6040. From this extreme zone, we expected the 2nd leg of the pullback to complete, then a 3rd leg should advance in a 5-wave structure. In the long run, trading in the direction of the prevailing trend tends to be most profitable. For NZDUSD, that trend remains to the upside from October 2022.
NZD/USD Elliott Wave analysis – 09.26.2024 four-hour chart
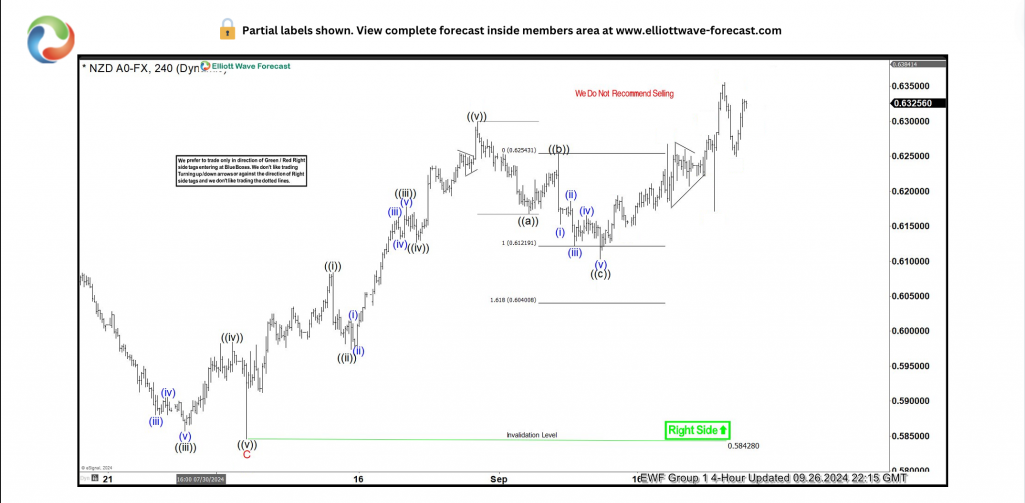
Eventually, the price found support at the extreme of the pullback, just as we had anticipated. The 2nd wave concluded at this level, and the 3rd wave began. The price broke above the 1st wave, confirming that the 3rd wave of the bullish cycle from August 5th should continue, with potential targets at least 0.65550, and possibly higher, towards 0.6830. Buyers from the zone have closed half of their positions and adjusted the rest to breakeven. With no remaining risk on the table, they can now wait for the next pullback to buy again.
Author

Elliott Wave Forecast Team
ElliottWave-Forecast.com


