NZD/USD Elliott Wave technical analysis [Video]
![NZD/USD Elliott Wave technical analysis [Video]](https://editorial.fxsstatic.com/images/i/NZDUSD-neutral-object_XtraLarge.png)
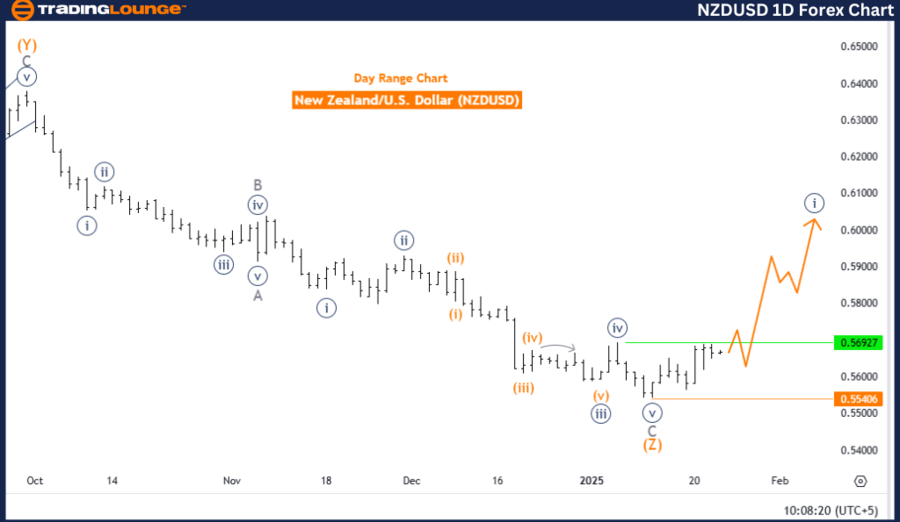
NZDUSD Elliott Wave Analysis Trading Lounge.
New Zealand Dollar/ U.S. Dollar (NZDUSD) Day Chart.
NZD/USD Elliott Wave technical analysis
-
Function: Bullish Trend.
-
Mode: Impulsive.
-
Structure: Navy Blue Wave 1.
-
Position: Gray wave 1.
-
Direction next lower degrees: Navy blue wave 2.
-
Details: Navy blue wave 1 as a new trend is in play.
-
Wave cancel invalidation level: 0.55406.
The analysis examines the NZDUSD currency pair using Elliott Wave Theory on the daily chart. It highlights a bullish trend with an impulsive mode, where navy blue wave 1 is the primary focus. This wave forms part of the broader gray wave 1, indicating the early stages of an upward trend.
Currently, navy blue wave 1 is active, suggesting strong upward momentum and reinforcing the bullish outlook. The next anticipated move is the formation of navy blue wave 2, expected to act as a corrective phase. This phase would temporarily consolidate the gains made during wave 1 before the bullish trend resumes.
The invalidation level for this wave structure is set at 0.55406, serving as a crucial reference point. If the price falls below this threshold, the bullish trend and wave structure would be invalidated, necessitating a reassessment of market expectations.
Conclusion
The NZDUSD daily chart analysis presents a positive market outlook driven by the active development of navy blue wave 1 within gray wave 1. The potential emergence of navy blue wave 2 provides traders with opportunities to monitor corrections before the trend continues.
The invalidation level plays a vital role in risk management by ensuring alignment with the Elliott Wave framework. This analysis provides a structured approach to market movements, enabling traders to make informed decisions in line with the prevailing bullish trend.
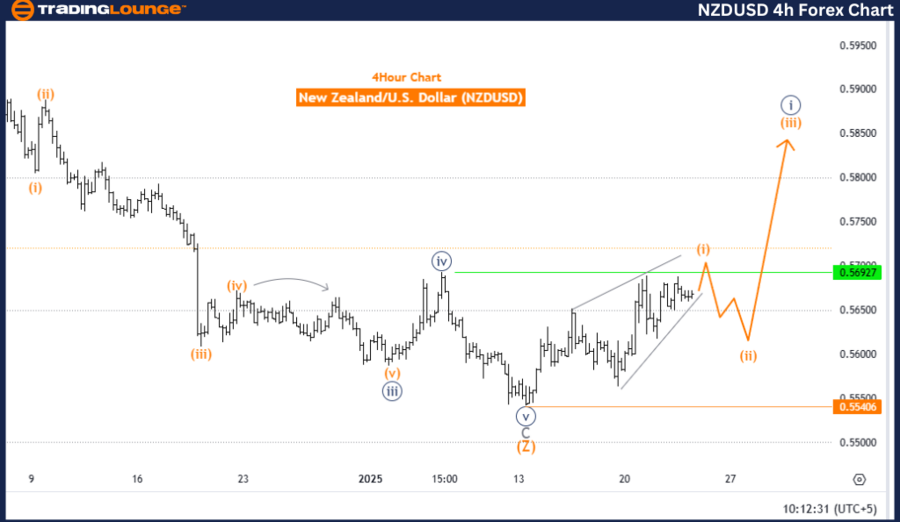
New Zealand Dollar/ U.S. Dollar (NZDUSD) 4-Hour Chart.
NZD/USD Elliott Wave technical analysis
-
Function: Bullish Trend.
-
Mode: Impulsive.
-
Structure: Orange wave 1.
-
Position: Navy Blue Wave 1.
-
Direction next lower degrees: Orange wave 2.
-
Details: Orange wave 1 of navy blue wave 1 as a new trend is in play.
-
Wave cancel invalidation level: 0.55406.
The analysis examines the NZDUSD currency pair using Elliott Wave Theory on the four-hour chart. It identifies a bullish trend characterized by an impulsive mode, focusing on the development of orange wave 1. This wave forms part of the broader navy blue wave 1 structure, signaling the beginning of a new upward movement in the market.
Currently, orange wave 1 is active within navy blue wave 1, showing strong upward momentum and marking the initial stage of the bullish trend. Once orange wave 1 concludes, the formation of orange wave 2 is anticipated as the next lower-degree movement. This phase is expected to act as a corrective move within the larger bullish framework.
The invalidation level for this wave structure is set at 0.55406, serving as a key benchmark to validate or invalidate the current market outlook. A price drop below this level would negate the bullish scenario, requiring a reassessment of the wave count.
Conclusion
The four-hour NZDUSD chart analysis presents a constructive bullish outlook, driven by the ongoing progression of orange wave 1 within navy blue wave 1. The potential emergence of orange wave 2 provides traders with an opportunity to observe the market for corrective movements before the trend resumes.
The invalidation level acts as a critical reference point for effective risk management, ensuring alignment with the projected Elliott Wave structure. This analysis provides valuable insights into the early stages of a new trend, aiding traders in making informed strategic decisions based on Elliott Wave principles.
Technical analyst: Malik Awais.
NZD/USD Elliott Wave technical analysis [Video]
Author

Peter Mathers
TradingLounge
Peter Mathers started actively trading in 1982. He began his career at Hoei and Shoin, a Japanese futures trading company.


