NZD/USD Elliott Wave technical analysis [Video]
![NZD/USD Elliott Wave technical analysis [Video]](https://editorial.fxstreet.com/images/Markets/Currencies/Majors/NZDUSD/new-zealand-currency-background-33709642_XtraLarge.jpg)
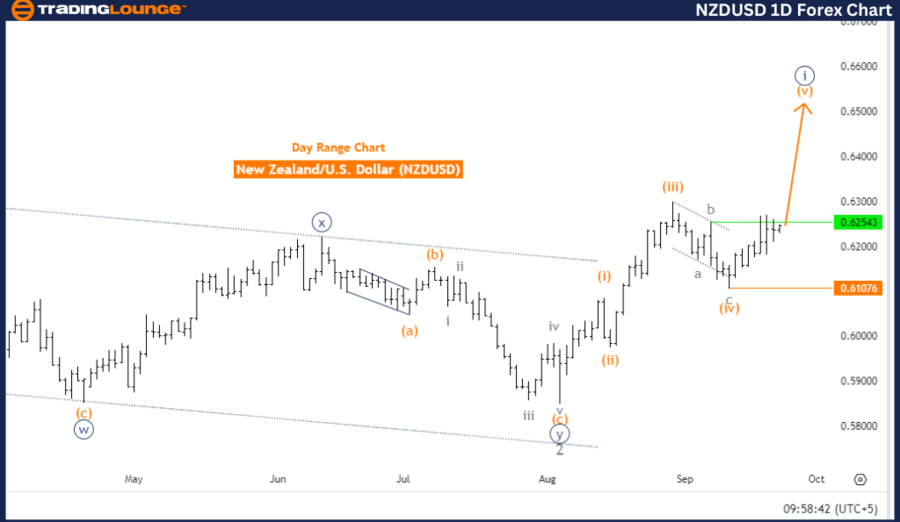
New Zealand Dollar/U.S. Dollar (NZDUSD) Day Chart
NZD/USD Elliott Wave technical analysis
-
Function: Trend.
-
Mode: Impulsive.
-
Structure: Orange wave 5.
-
Position: Navy Blue Wave 1.
-
Next lower degree direction: Navy blue wave 2.
-
Details: Orange wave 4 is completed, and now orange wave 5 of navy blue wave 1 is in play.
-
Wave cancel invalidation level: 0.61076.
The Elliott Wave analysis for the NZDUSD daily chart suggests that the market is currently in a trend phase and moving in an impulsive mode. This indicates that the price is following a strong directional movement. The observed structure is orange wave 5, which usually marks the final wave in the impulsive sequence, signaling the potential end of the current wave cycle.
At this stage, the market is positioned in navy blue wave 1, which signifies the start of a new larger wave cycle. This wave is part of a broader trend, and the analysis suggests that the next lower degree, navy blue wave 2, is likely the upcoming phase, indicating a corrective phase may follow after the completion of the current impulsive wave.
Details from the analysis show that orange wave 4 has been completed, marking the conclusion of the previous corrective phase. Currently, orange wave 5 of navy blue wave 1 is in progress, indicating the final leg of the current upward or downward movement is underway. This phase is expected to continue pushing the market in the direction of the existing trend, completing the wave cycle.
The wave cancel invalidation level is set at 0.61076. If the price falls below this level, the current wave structure will be invalidated, and a reassessment of the wave count and overall trend will be necessary.
Summary:
The NZDUSD pair is in an impulsive trend phase, with orange wave 5 of navy blue wave 1 currently in progress. The analysis expects the trend to continue, with potential corrections in navy blue wave 2 after the completion of wave 5, as long as the price remains above 0.61076.
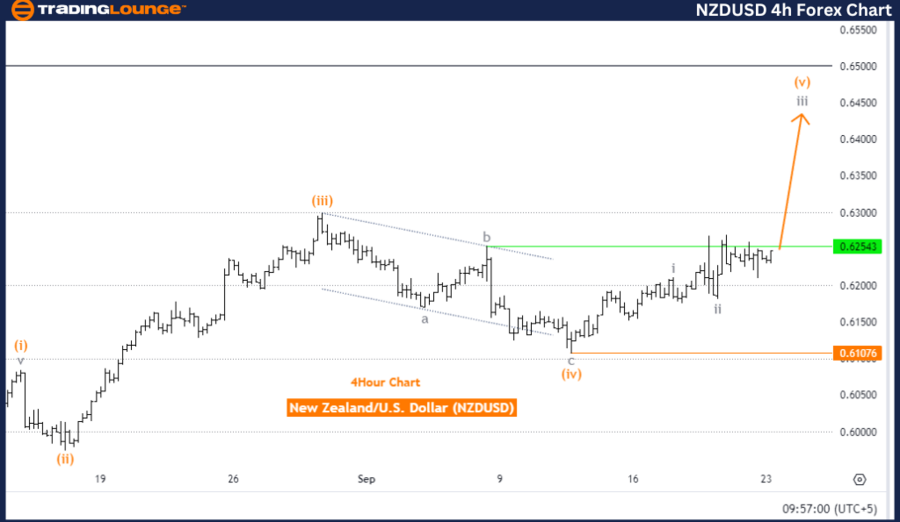
New Zealand Dollar/ U.S. Dollar (NZDUSD) 4-Hour Chart.
NZD/USD Elliott Wave technical analysis
-
Function: Trend.
-
Mode: Impulsive.
-
Structure: Gray wave 3.
-
Position: Orange wave 5.
-
Next higher degree direction: Gray wave 3 (started).
-
Details: Gray wave 2 is completed, and gray wave 3 is now in progress.
-
Wave cancel invalidation level: 0.61076.
The Elliott Wave analysis for the NZDUSD 4-hour chart suggests that the market is in a trend mode, moving impulsively. This indicates that the price is following the dominant trend with strong momentum. The current structure being observed is gray wave 3, indicating that the price is in a strong upward or downward movement depending on the overall direction of the trend.
At present, the market is positioned in orange wave 5, which is part of the larger gray wave 3 structure. This suggests that the current phase of the market is nearing the end of an impulsive wave cycle, as wave 5 typically marks the final wave in a standard Elliott Wave impulsive sequence. The analysis indicates that gray wave 3 has already started, and the market is progressing within this wave.
The details reveal that gray wave 2 has been completed, marking the end of the previous corrective phase. Now, the market is advancing in gray wave 3, which represents an impulsive and strong continuation of the trend. This phase is expected to drive the market further in the direction of the overall trend.
The wave cancel invalidation level is set at 0.61076, meaning that if the price falls below this level, the current wave structure will be invalidated, requiring the analysis to be revised.
Summary:
The NZDUSD pair is in a trending phase, with gray wave 3 in progress after the completion of gray wave 2. The market is expected to continue moving impulsively as part of orange wave 5, and the analysis remains valid as long as the price stays above 0.61076, indicating continued momentum in the direction of the trend.
Technical analyst: Malik Awais.
NZD/USD Elliott Wave technical analysis [Video]
Author

Peter Mathers
TradingLounge
Peter Mathers started actively trading in 1982. He began his career at Hoei and Shoin, a Japanese futures trading company.


