NZD/USD Elliott Wave technical analysis [Video]
![NZD/USD Elliott Wave technical analysis [Video]](https://editorial.fxstreet.com/images/Markets/Currencies/Majors/NZDUSD/new-zealand-currency-background-33709642_XtraLarge.jpg)
NZD/USD Elliott Wave technical analysis
-
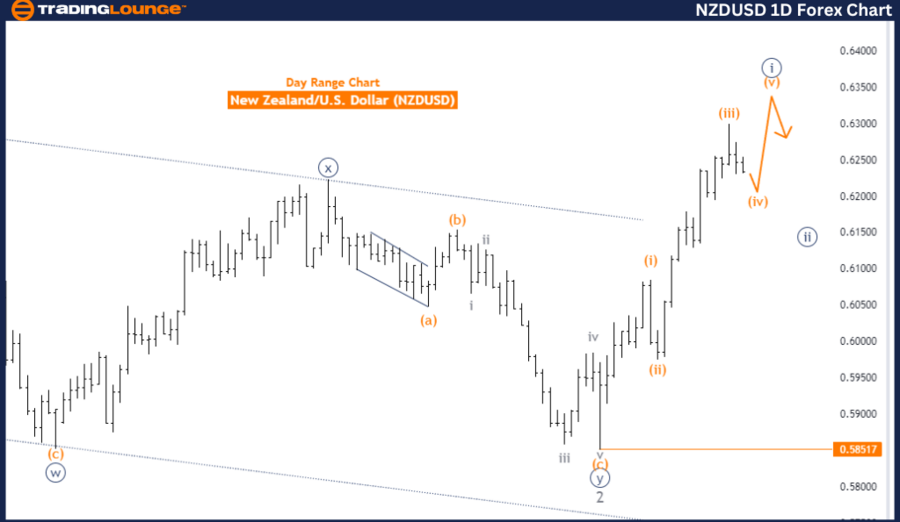
Function: Counter Trend.
-
Mode: Corrective.
-
Structure: Orange Wave 4.
-
Position: Navy Blue Wave 1.
-
Direction next higher degrees: Orange Wave 5.
-
Details: Orange Wave 3 appears to be completed, and now Orange Wave 4 of 1 is in progress.
-
Wave cancel invalidation level: 0.58517.
The NZD/USD daily chart presents a counter-trend scenario according to Elliott Wave analysis, indicating that the market is currently in a corrective phase. The primary structure under examination is Orange Wave 4, which follows the completion of Orange Wave 3. This suggests that the ongoing market activity represents a corrective movement rather than a continuation of the previous trend.
The market is positioned within Navy Blue Wave 1, signifying the commencement of a new wave cycle. However, it is experiencing a pullback due to the corrective nature of Orange Wave 4. The analysis suggests that Orange Wave 4 is still underway, following the completion of Orange Wave 3, which previously propelled the market higher.
The next higher degree direction points towards the formation of Orange Wave 5. This implies that after the completion of the current corrective phase (Orange Wave 4), the market is expected to resume its upward movement as part of the broader trend, transitioning into Orange Wave 5.
In summary, the NZD/USD daily chart is presently in a corrective phase, with Orange Wave 4 in progress following the completion of Orange Wave 3. The market is within Navy Blue Wave 1, indicating the start of a new wave sequence. The analysis anticipates that the market will eventually continue its upward trend into Orange Wave 5 once the current correction is complete. The analysis remains valid as long as the price does not fall below the wave cancel invalidation level of 0.58517.
NZD/USD day chart
NZD/USD Elliott Wave technical analysis
-
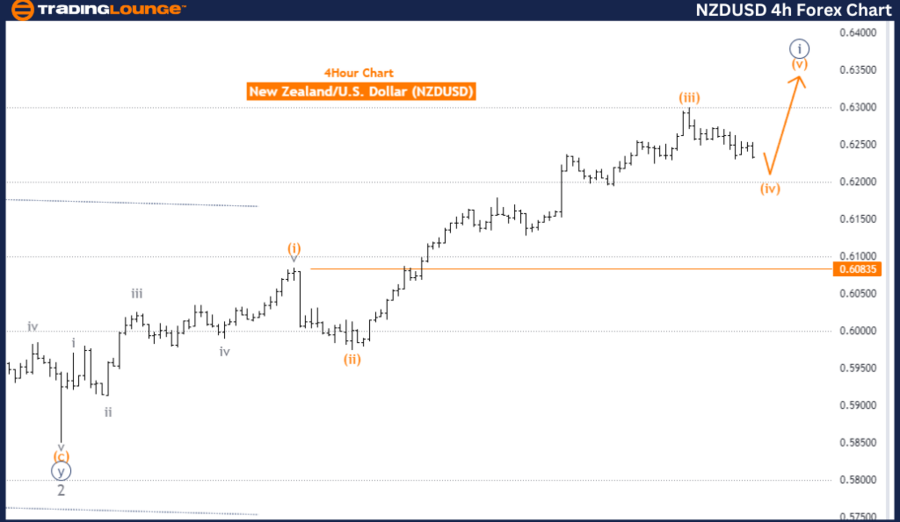
Function: Counter Trend.
-
Mode: Corrective.
-
Structure: Orange Wave 4.
-
Position: Navy Blue Wave 1.
-
Direction next higher degrees: Orange Wave 5.
-
Details: Orange Wave 3 appears to be completed, with Orange Wave 4 of 1 currently unfolding.
-
Wave cancel invalidation level: 0.60835.
The NZD/USD four-hour chart indicates a counter-trend scenario based on Elliott Wave analysis, highlighting that the market is presently in a corrective phase. The primary focus is on Orange Wave 4, which forms part of this corrective sequence. The currency pair is positioned within Navy Blue Wave 1, signifying the early stages of a new wave cycle.
Following the completion of Orange Wave 3, the development of Orange Wave 4 is now underway. This suggests that the market is experiencing a retracement within the larger trend context, correcting the movements observed in the previous wave.
Looking ahead, the next higher degree points toward the formation of Orange Wave 5, which is anticipated to commence once Orange Wave 4 concludes. This progression implies that the market may resume its upward trajectory, continuing the established wave sequence with the initiation of Orange Wave 5.
In summary, the NZD/USD four-hour chart is currently experiencing a corrective movement through Orange Wave 4 after completing Orange Wave 3. Positioned within Navy Blue Wave 1, this setup indicates the beginning of a new trend sequence. The analysis projects that upon the completion of Orange Wave 4, the market is likely to advance into Orange Wave 5, perpetuating the overall Elliott Wave pattern. This outlook remains valid provided the price stays above the wave cancel invalidation level of 0.60835.
NZD/USD four-hour chart
NZD/USD Elliott Wave technical analysis [Video]
Author

Peter Mathers
TradingLounge
Peter Mathers started actively trading in 1982. He began his career at Hoei and Shoin, a Japanese futures trading company.


