NZD/USD Elliott Wave technical analysis [Video]
![NZD/USD Elliott Wave technical analysis [Video]](https://editorial.fxstreet.com/images/Markets/Currencies/Majors/NZDUSD/new-zealand-currency-background-33709642_XtraLarge.jpg)
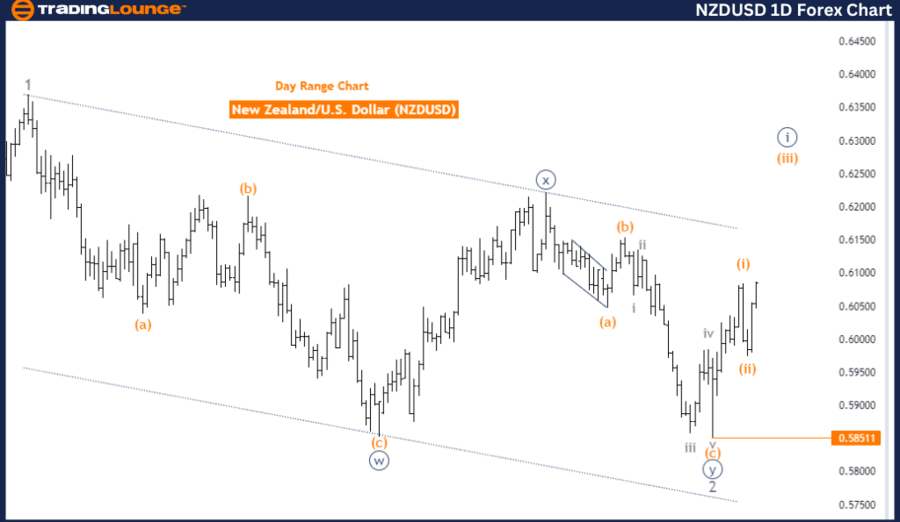
NZDUSD Elliott Wave Analysis - Trading Lounge Day Chart.
New Zealand Dollar/ U.S. Dollar (NZDUSD) Day Chart.
NZD/USD Elliott Wave technical analysis
Function: Trend.
Mode: Impulsive.
Structure: Orange Wave 3.
Position: Navy Blue Wave 1.
Direction next higher degrees: Orange Wave 3 (continue).
Details: Orange Wave 2 appears completed; now, Orange Wave 3 of 1 is in play.
Wave cancel invalid level: 0.58511
The NZDUSD daily chart, analyzed through Elliott Wave theory, shows the market currently trending upwards with an impulsive wave structure in focus. The main wave under scrutiny is Orange Wave 3, indicating ongoing bullish momentum. This wave belongs to a broader degree wave structure identified as Navy Blue Wave 1, suggesting the possibility of the market being in the initial stages of a longer-term upward trend.
Orange Wave 2, which represented a corrective phase within this sequence, seems to have concluded. Following this correction, Orange Wave 3 has commenced, signaling that the market is experiencing an upward push. In Elliott Wave theory, Wave 3 is typically the most powerful and longest wave in the sequence, often leading to significant price increases.
The next higher degree wave, Orange Wave 3, is expected to maintain its upward path as the market continues through this impulsive phase. The current wave count suggests that further upward movement is likely as Orange Wave 3 develops.
A crucial level to watch is the wave cancel invalid level at 0.58511. If the market drops below this level, it would invalidate the current Elliott Wave count, implying a possible change in the wave structure or a trend reversal.
In summary, the NZDUSD daily chart shows a strong upward trend, with Orange Wave 3 in progress following the completion of Orange Wave 2. The market is expected to continue rising as part of this Wave 3, with the invalidation level at 0.58511 being critical; a breach would indicate a potential shift in the current wave analysis.
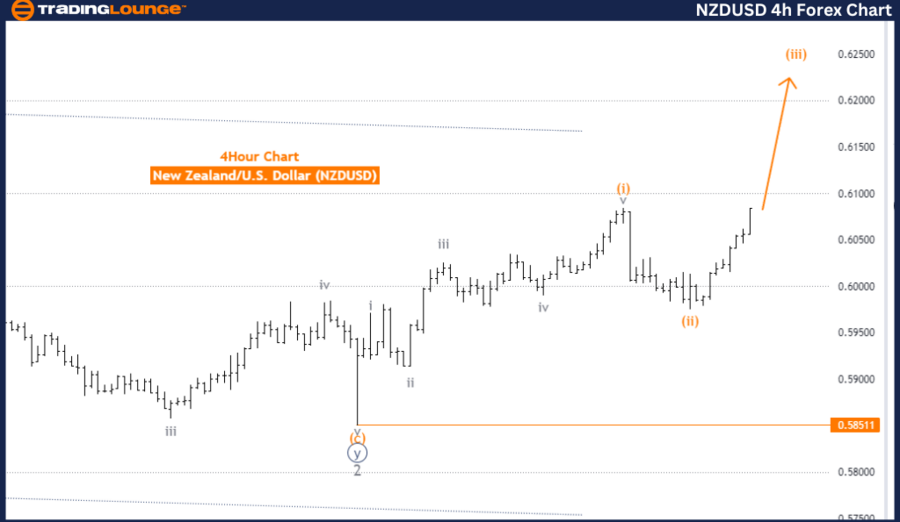
NZDUSD Elliott Wave Analysis - Trading Lounge 4-Hour Chart.
New Zealand Dollar/ U.S. Dollar (NZDUSD) 4-Hour Chart.
NZD/USD Elliott Wave technical analysis
Function: Trend.
Mode: Impulsive.
Structure: Orange Wave 3.
Position: Navy Blue Wave 1.
Direction next higher degrees: Orange Wave 3 (continue)
Details: Orange Wave 2 appears completed; now, Orange Wave 3 of 1 is in play.
Wave cancel invalid level: 0.58511.
The NZDUSD 4-hour chart, analyzed through Elliott Wave theory, is currently in a strong upward trend, characterized by an impulsive wave structure. The main wave under focus is Orange Wave 3, indicating a continuation of the bullish momentum. This wave belongs to a larger degree wave structure identified as Navy Blue Wave 1, suggesting the market might be in the early stages of a potential long-term upward trend.
Orange Wave 2, representing a corrective phase within this sequence, seems to have concluded. Following the completion of this correction, Orange Wave 3 has begun, signaling that the market is currently experiencing an upward movement. In the Elliott Wave sequence, Wave 3 is typically the most powerful and extended wave, often leading to significant price gains.
The direction of the next higher degree wave, Orange Wave 3, is expected to continue its upward trajectory as it progresses through this impulsive phase. The current wave count implies that the market is poised for further gains as Orange Wave 3 continues to develop.
A critical level to monitor is the wave cancel invalid level, set at 0.58511. If the market drops below this point, it would invalidate the current Elliott Wave count, suggesting a potential shift in the wave structure or a reversal in the trend.
In summary, the NZDUSD 4-hour chart shows a strong upward trend, with Orange Wave 3 currently unfolding after the completion of Orange Wave 2. The market is expected to continue rising as part of this Wave 3, with the key invalidation level being 0.58511, which serves as a crucial point in the current wave analysis.
Technical analyst: Malik Awais.
NZD/USD Elliott Wave technical analysis [Video]
Author

Peter Mathers
TradingLounge
Peter Mathers started actively trading in 1982. He began his career at Hoei and Shoin, a Japanese futures trading company.


